| |
Age Effect Other Analyses:
NMS Ordination:
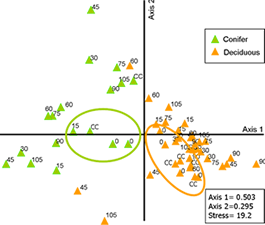
The data was explored using NMS ordination to assess patterns within the community structures of the different sites. Within the ordination it is evident that there are three distinct groups separating out based on the age of the edge (Figure 2).. We also see some evidence of the clear-cut and zero meter sites grouping out within most of the edge ages. Since all edge ages had transects running into similar "intact" forest sites, I would have expected to see the sites farther into the transects being more similar between edge ages. I also expected to see some close similarity between the 2 year old and 8 year old zero meter sites, with the 15 year old zero meter treatments being more similar to intact forest sites as was suggested by the NCAP analysis in the main analysis section. Although the ordination is still interesting, I did not include the NMS in the final analysis because of the high stress value in the ordination. This suggests that the picture presented is not a reliable representation of the actual data set and thus should not be used for data interpretation at this time (McCune and Grace, 2002).
Bray-Curtis (Polar) Ordination:
Once again I first thought the Bray-Curtis ordination would be beneficial for looking at the edge gradients within the edge ages analysis. The ordination formed two distinct groups, with the eight year old edge sites grouping out separately from the 2 year old and 15 year old sites (Figure 3). Some grouping of the 15 year old 0 meters treatments was evident with sites further into the intact forest, however the trend was limited. I again determined my data did not meet the assumptions of the Bray-Curtis ordination as I have multiple gradients within the larger dataset, and not the single gradient assumed by this ordination technique.
Hierarchical Clustering Analysis:
The analysis resulted in a clear differentiation between all of the three ages edge sites (Figure 4). An interesting result of this analysis was that none of the intact forest sites from different aged edges grouped together. This was an expected result as the forest transects are all in stands of similar origin (80-120 years). Some sites did group out as expected in this analysis, but the main result was a clear representation of a data set with high amounts of variability. This variability appears to be so high even between intact forest control (ie: 105 meters sites in all transects) that there is no ability of the analysis to assess the underlying question of edge recovery over time. This analysis may be better served when combined with an additional years worth of data, which was collected in the summer of 2007. |
|

Figure 2: Non-metric multidimensional scaling ordination using the Bray-Curtis dissimilarity index for data of various edge ages. Text indicates distance from forest edge in meters with CC representing clear-cut sites.

Figure 3: Bray-Curtis (Polar) ordination using Bray-Curtis dissimilarity index comparing edge effects between cover types. Text indicates distance from forest edge in meters with CC representing clear-cut sites.

Figure 4: Hierarchichal clustering analysis based on the Bray-Curtis dissimilarity index. Dendrogram represents sites which are more similar on the left hand side, and sites less similar are split apart nearer the right hand side. Labels represent distance from forest edge and CC represents clear-cut sites.
|
|