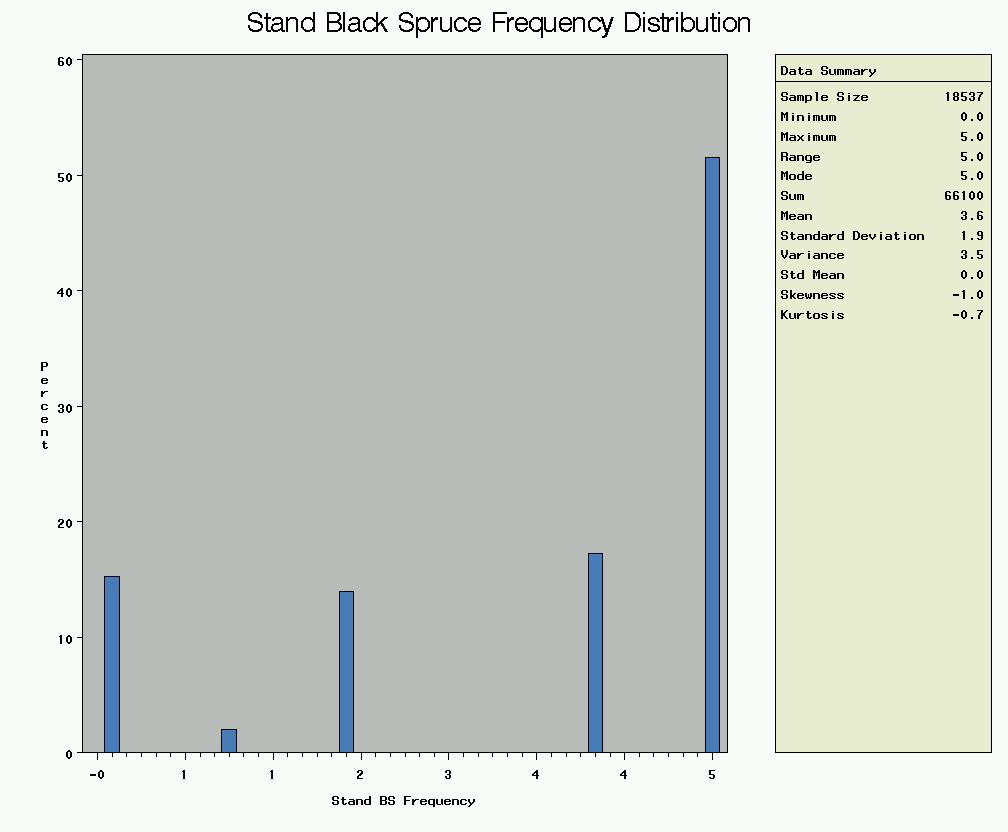
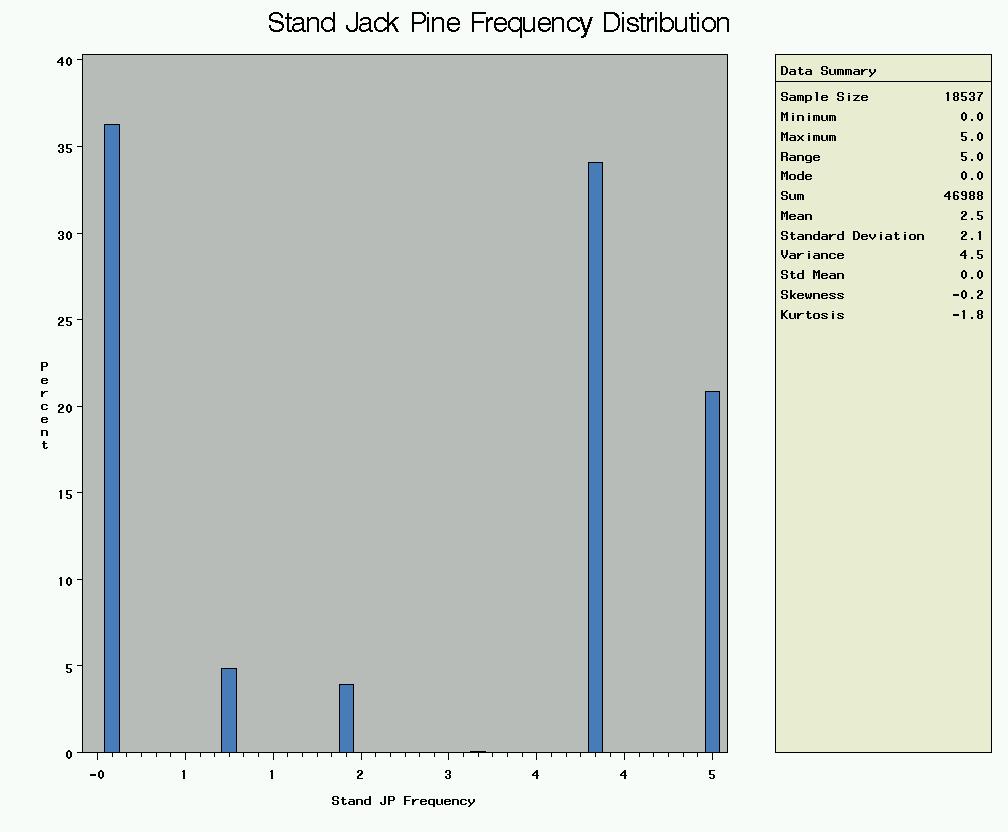
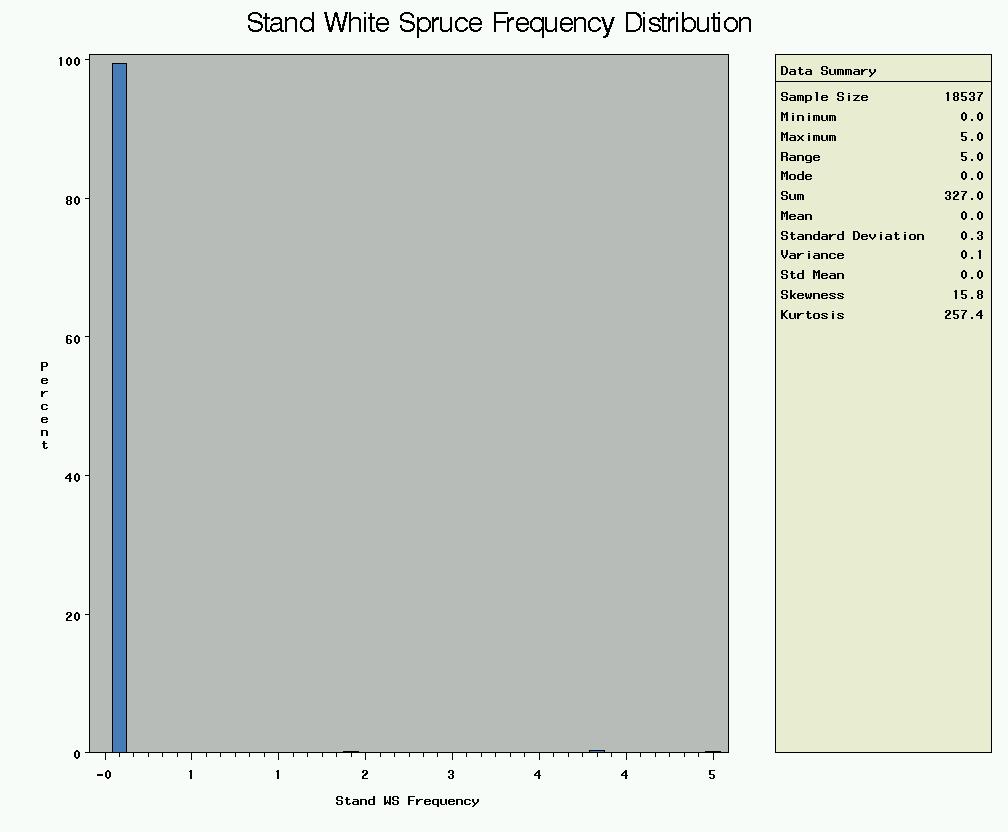
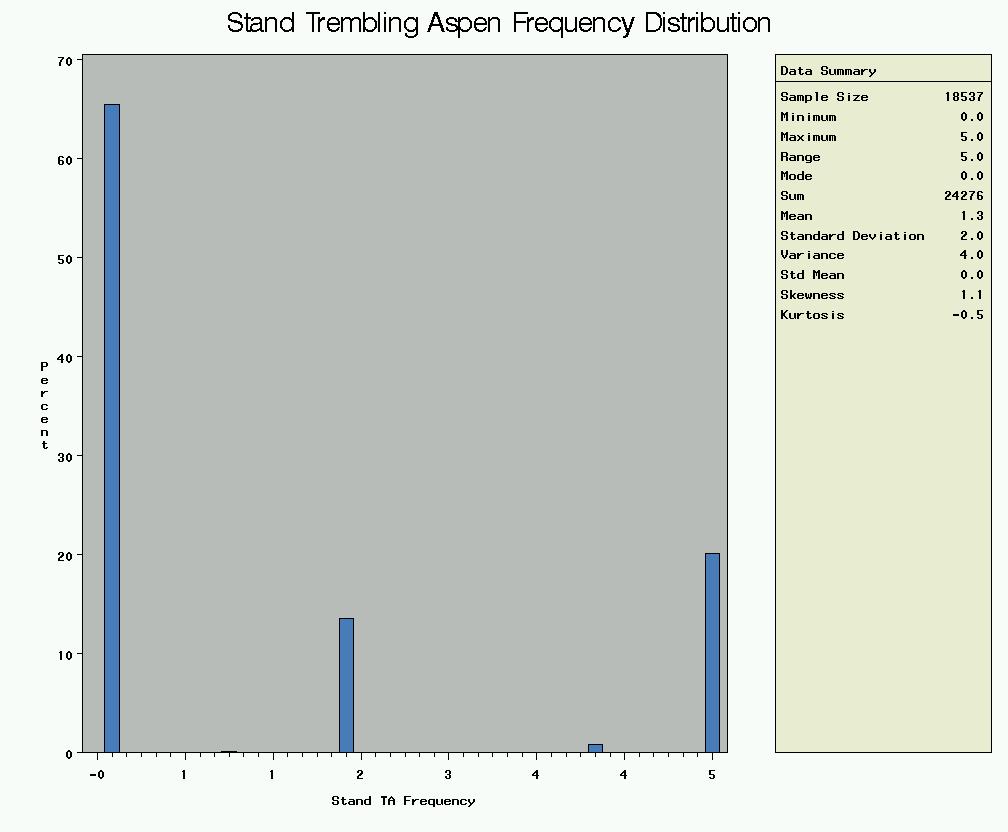
The following figures illustrate the species frequencies as percentages of the total number of stands in the analysis.
By far the major species represented in the study area were black spruce and jack pine. Over 50% of the stands in the study
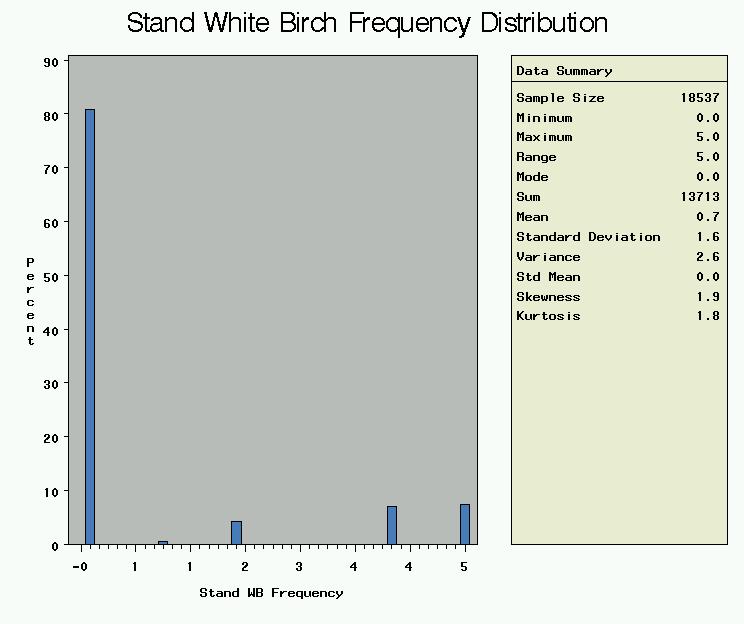
area had black spruce as the leading species. A relatively small proportion of the stands were trembling aspen or white
birch leading and a minute number of stands had a white spruce component.
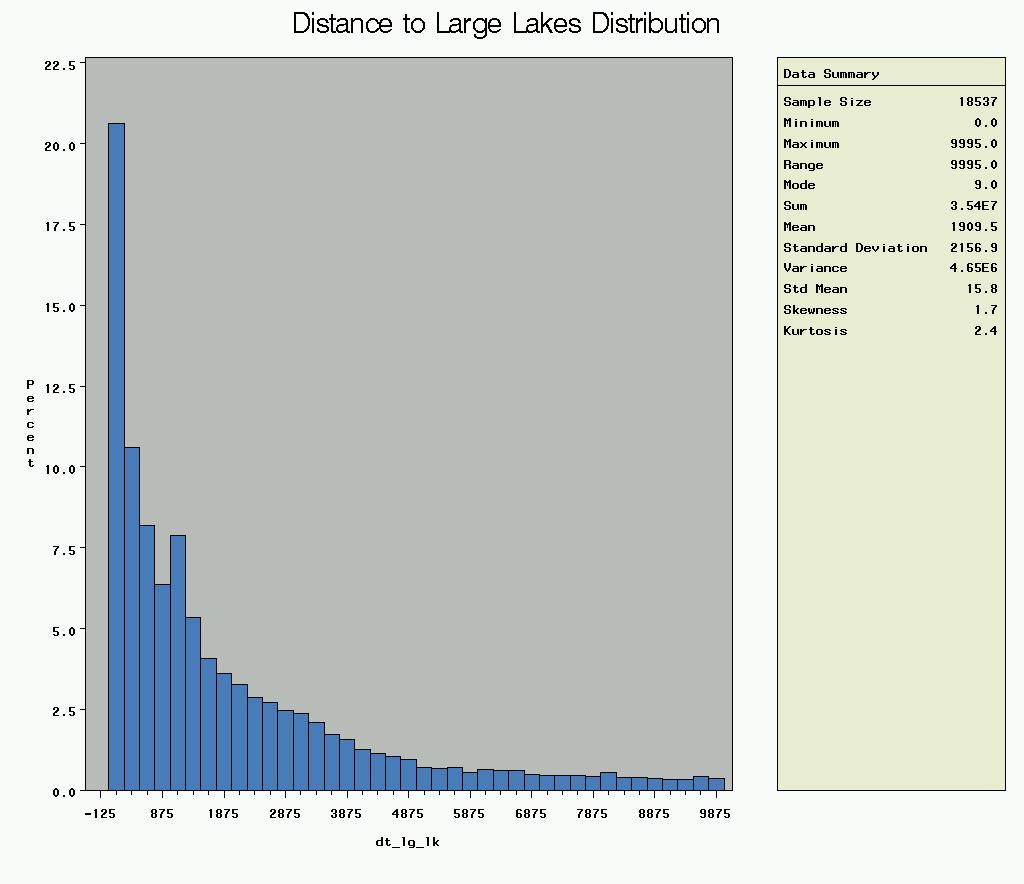
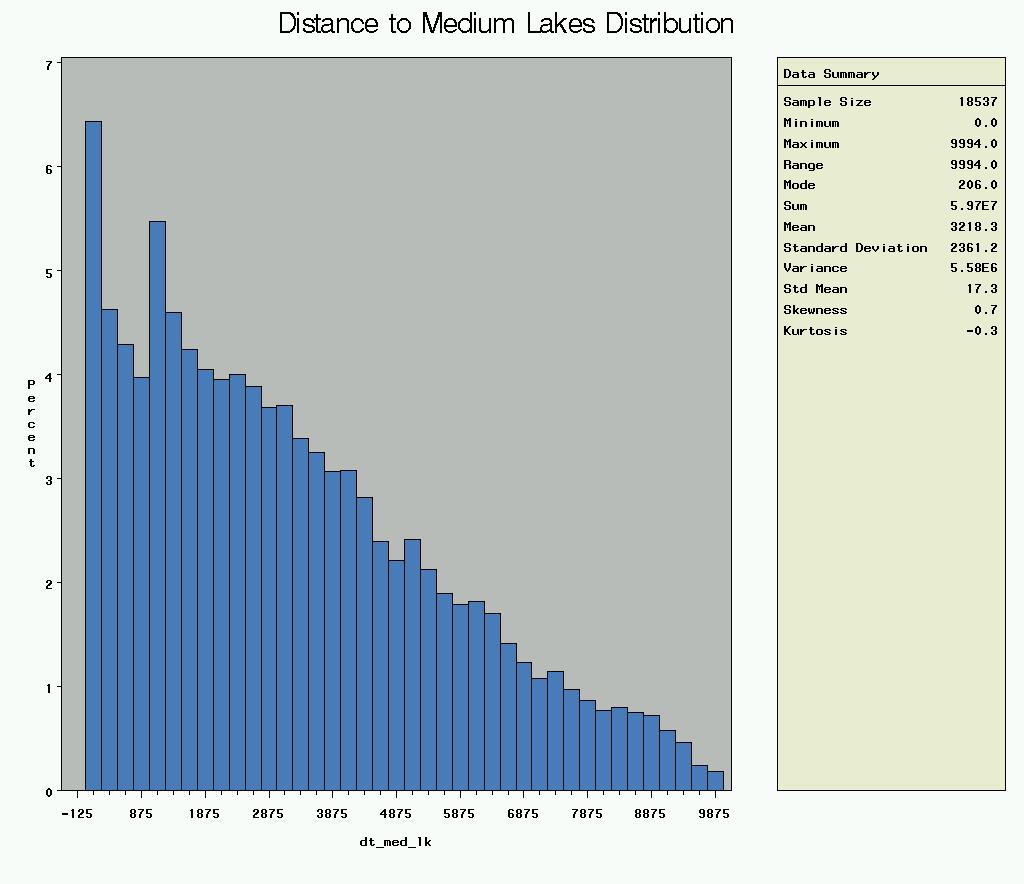
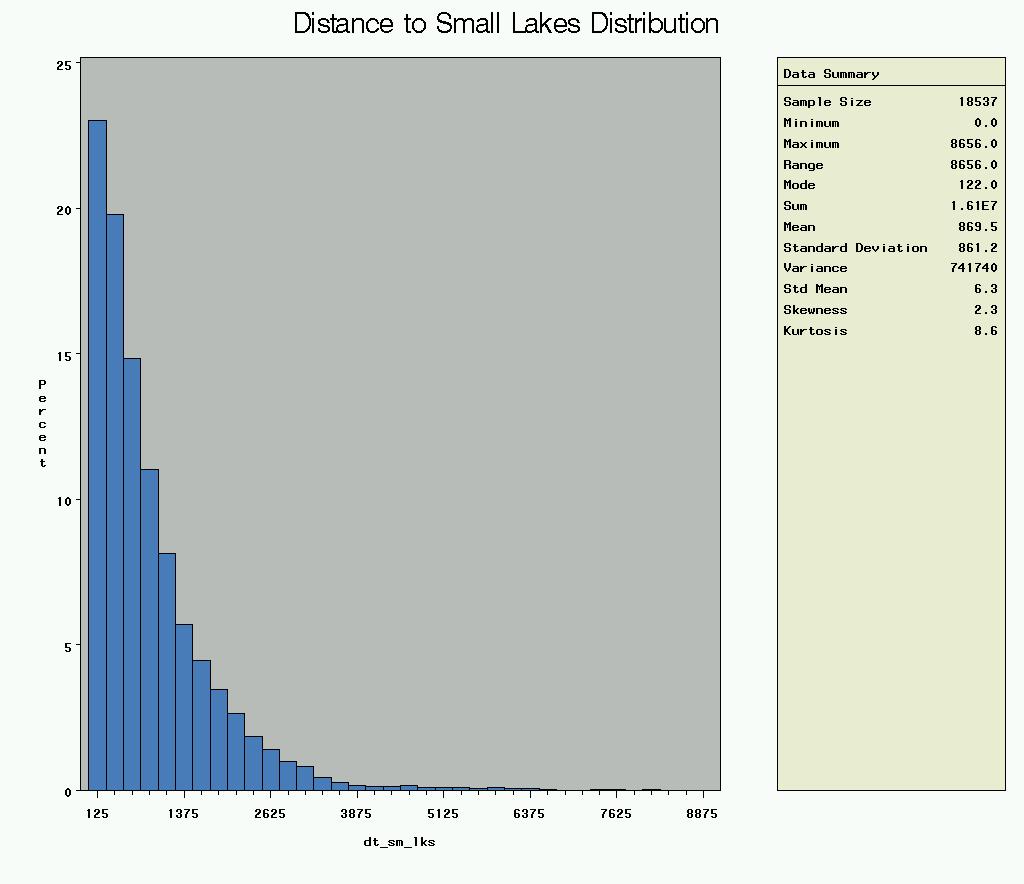
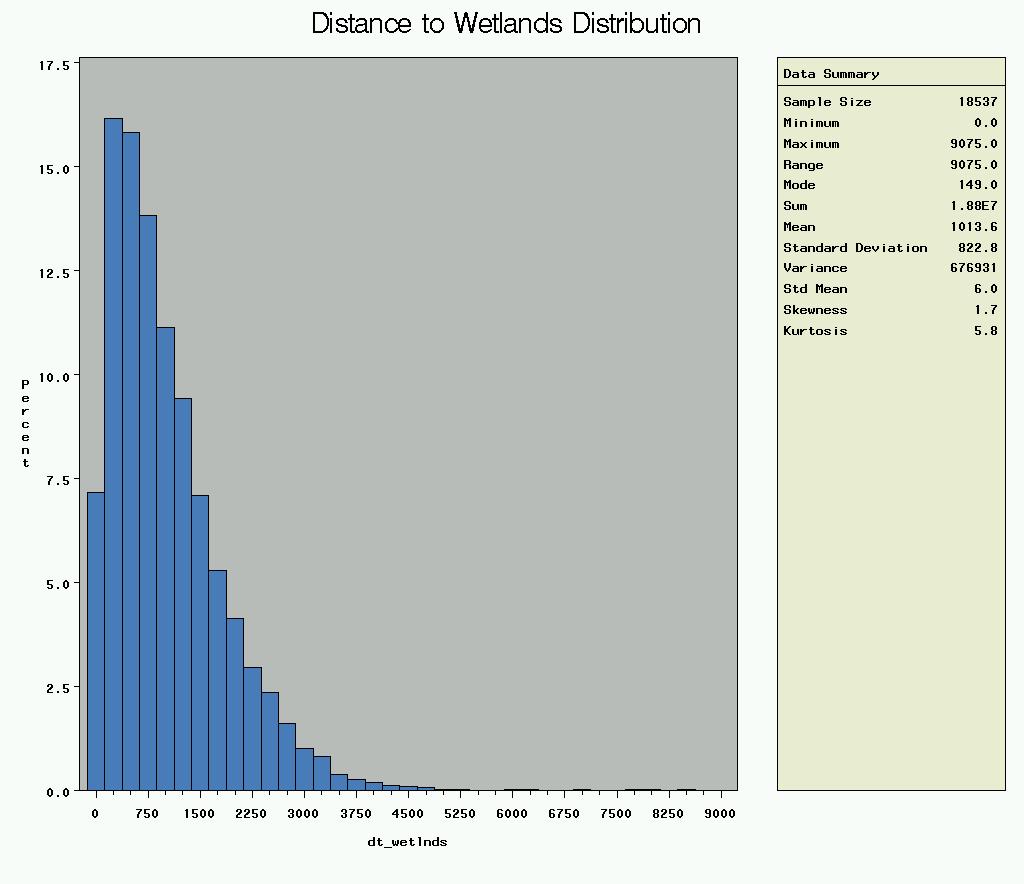
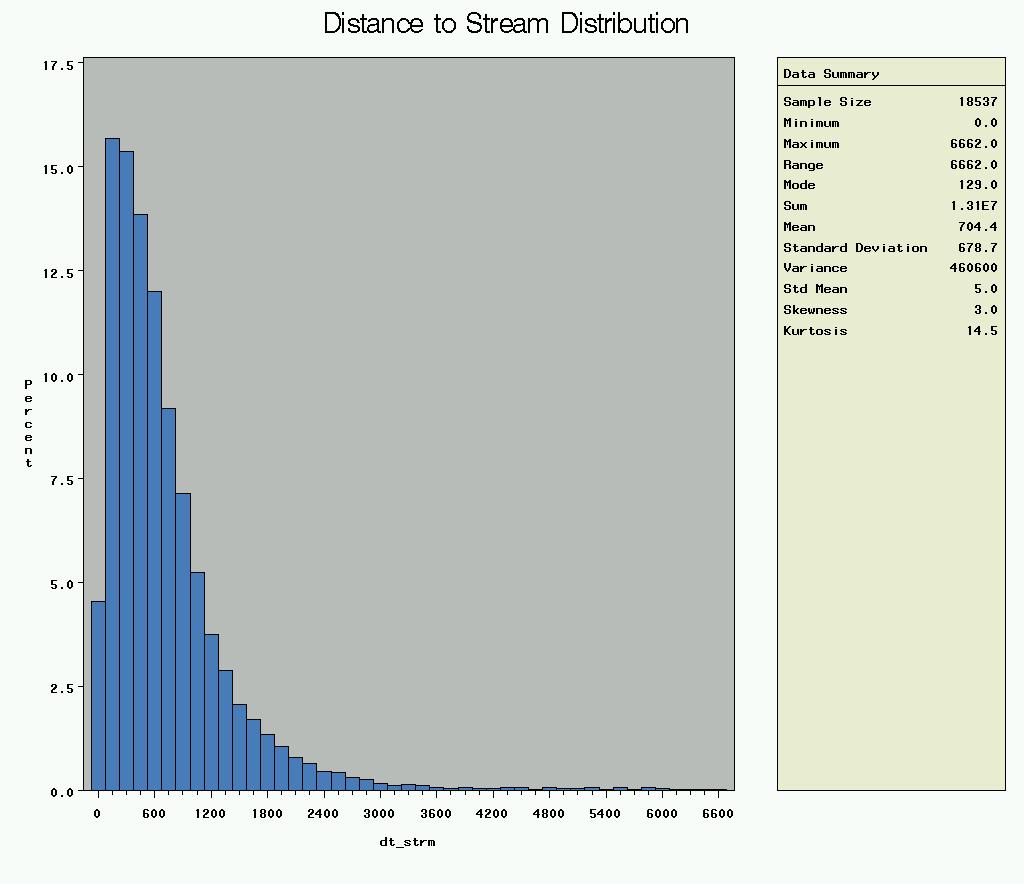
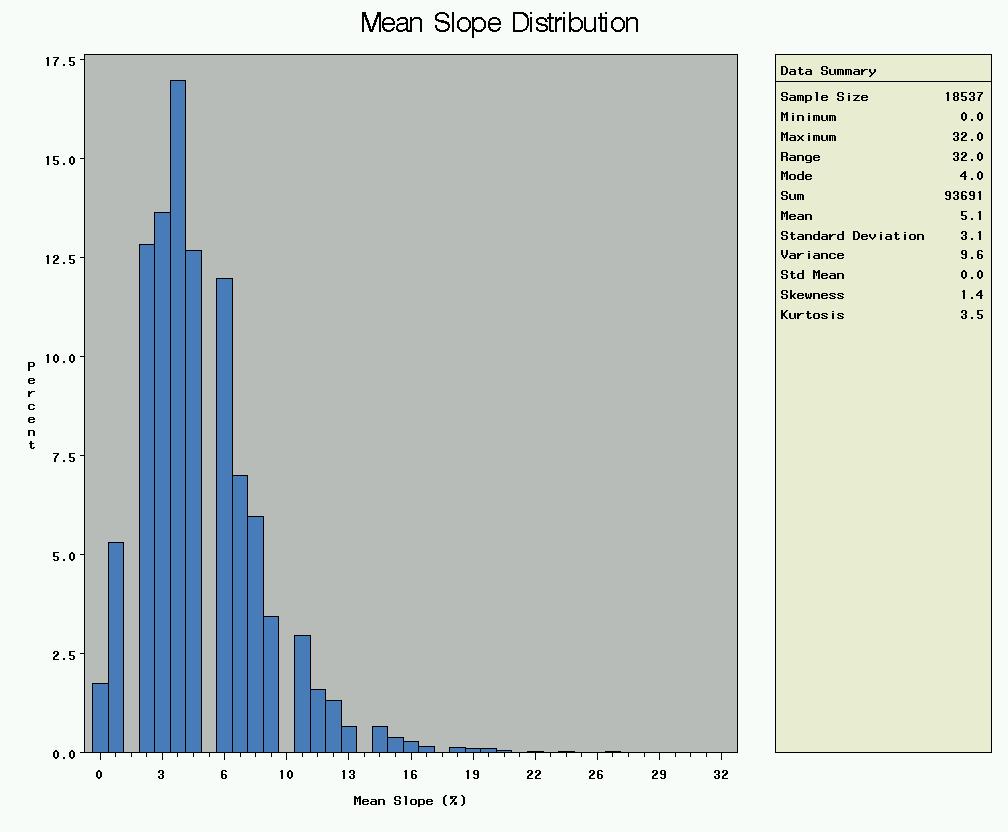
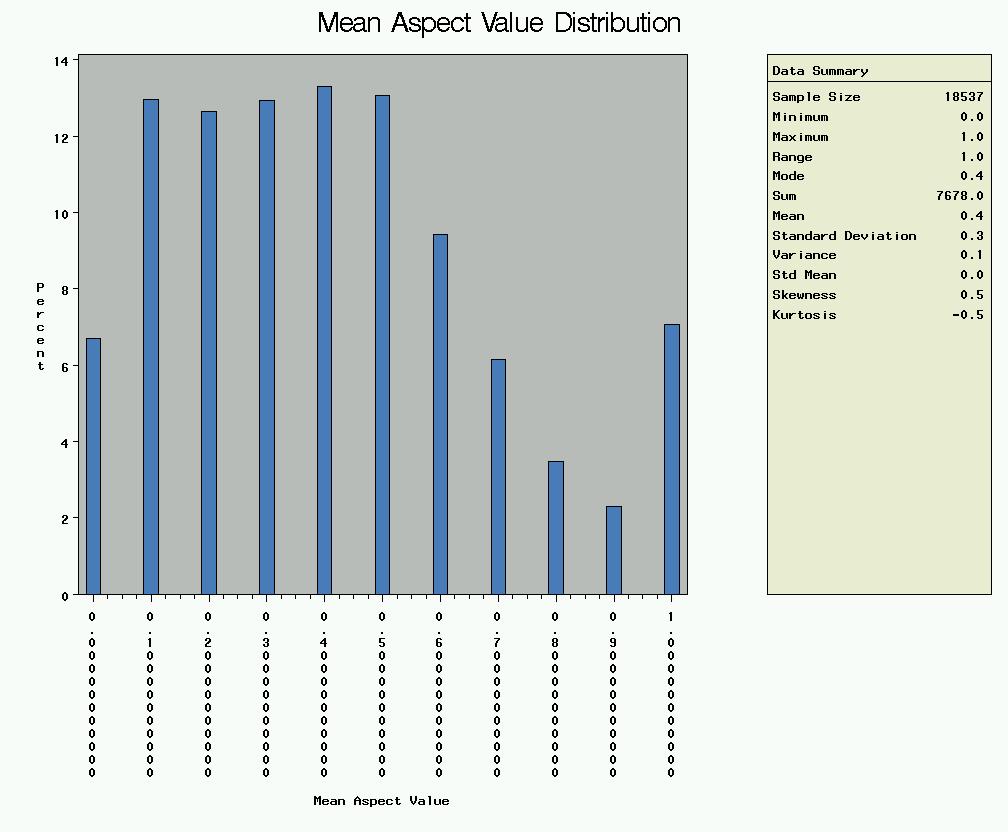
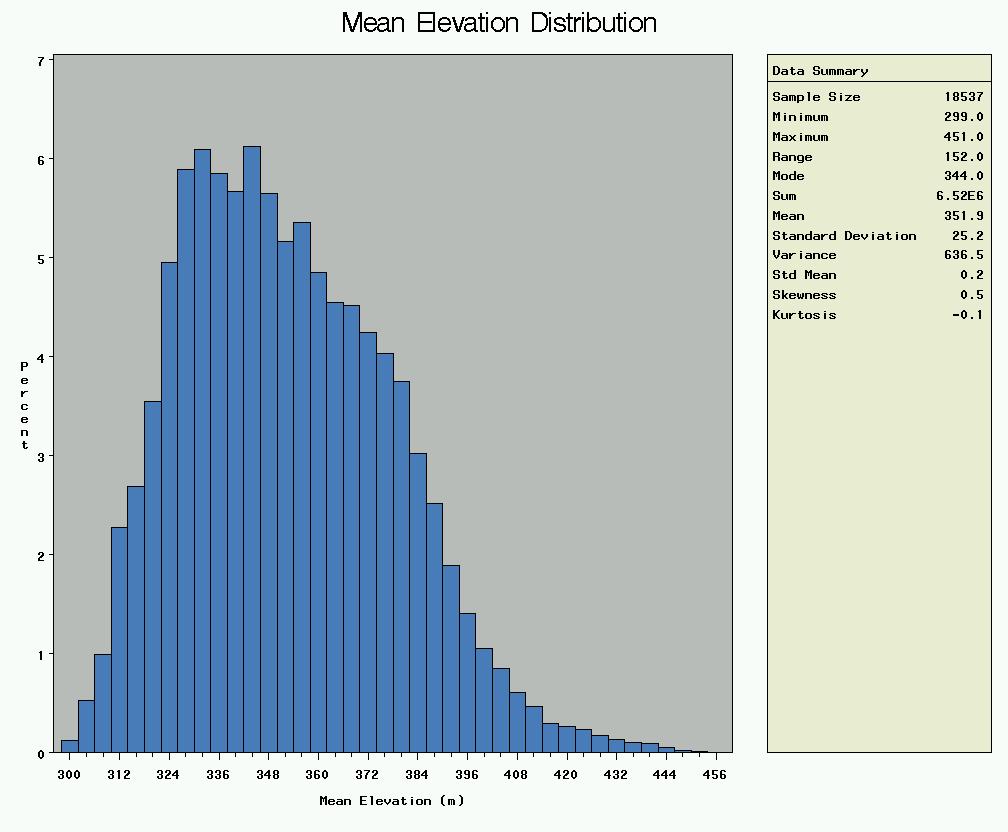
The following figures illustrate the distribution of landscape variables as percentages of the total number of stands in the
analysis. A large degree of skewness and kurtosis is evident in many of the variables. Various data transformations were
attempted in order to reduce skewness and kurtosis and improve the linear relationship between independent and dependent variables.
The transformations were successful in reducing skewness and kurtosis, as would be expected, but no improvement in the
variable relationships were identified. Due to this lack of improvement, the non-transformed variables were used in all statisical analysis.