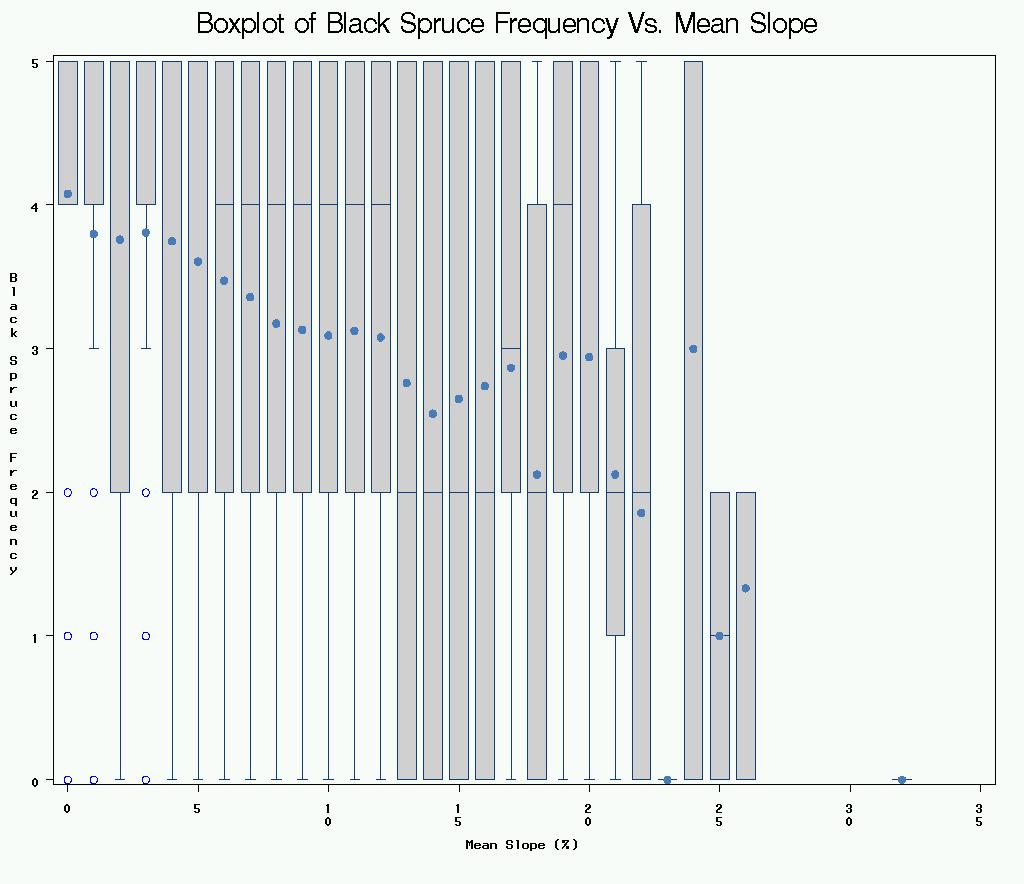
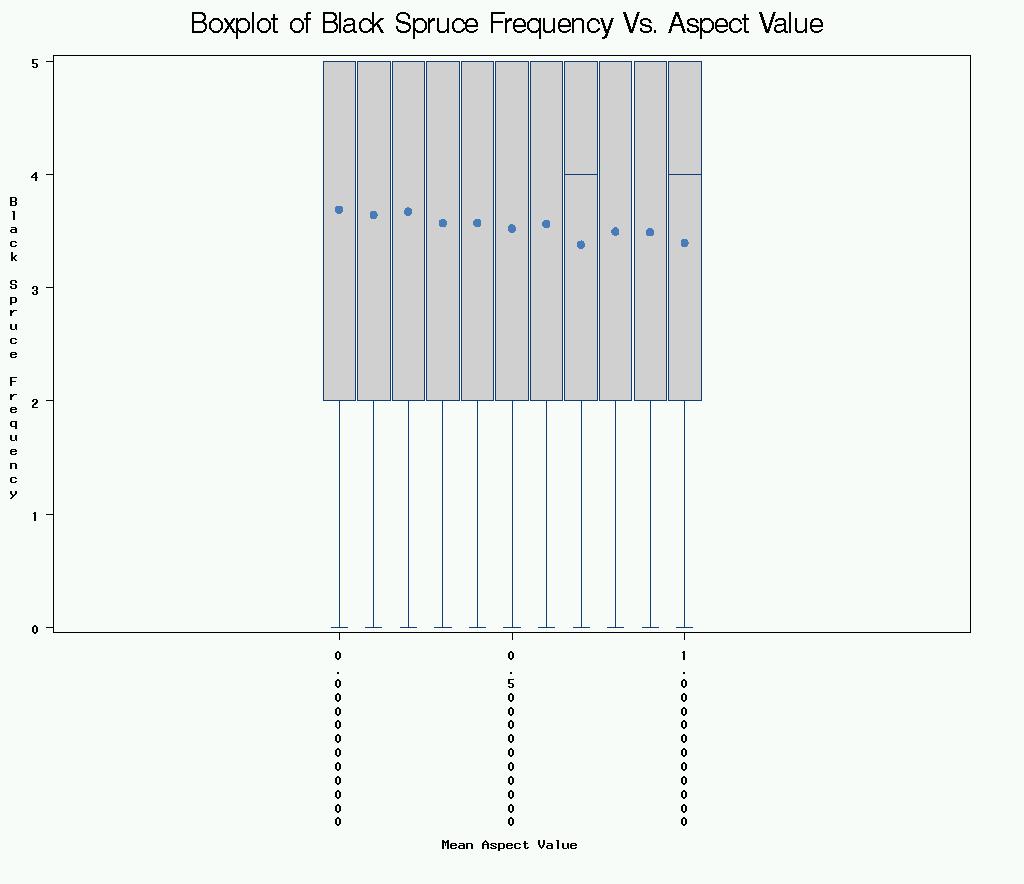
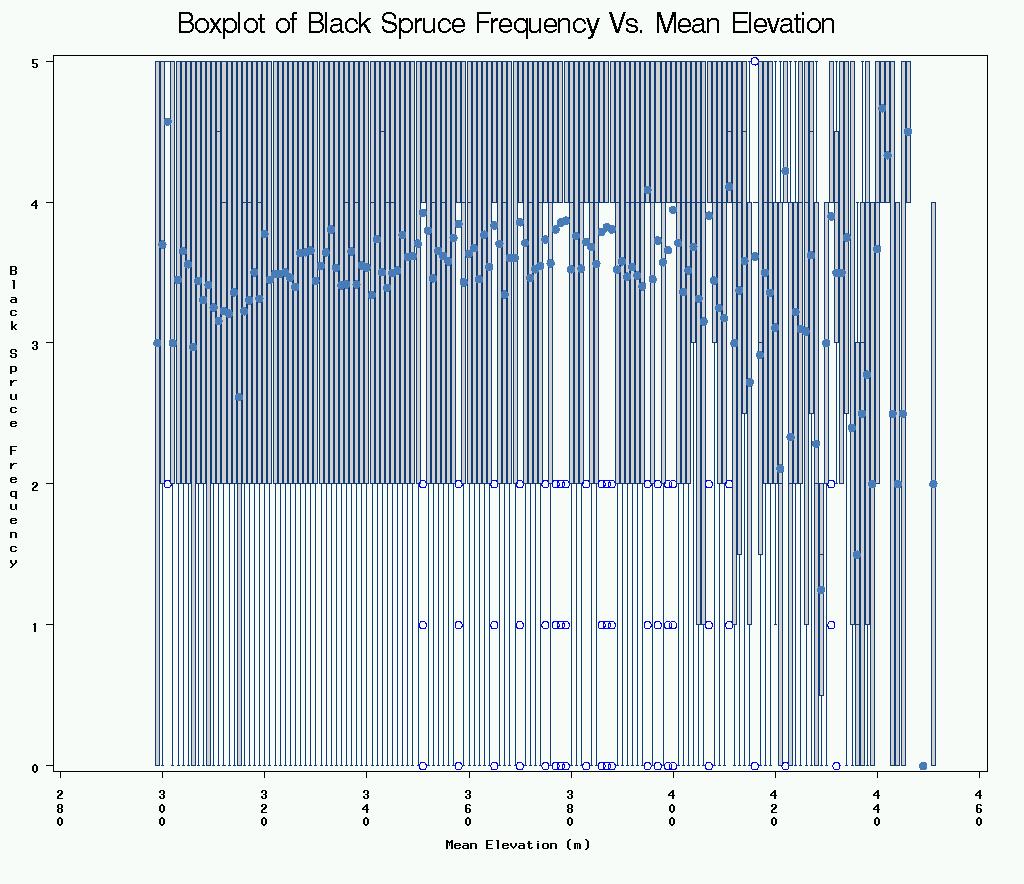
Sample boxplots depicting black spruce and selected landscape variables. A large degree of variability is evident in the
boxplots which was present in all of the relationships when plotted graphically.
The dots represent the mean for a particular value.