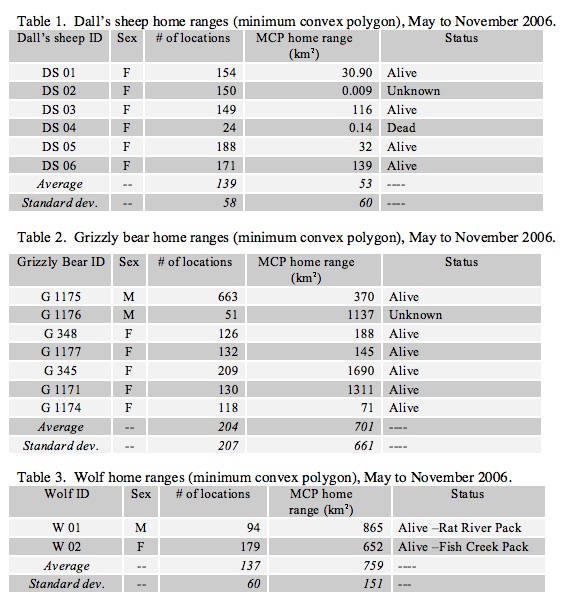
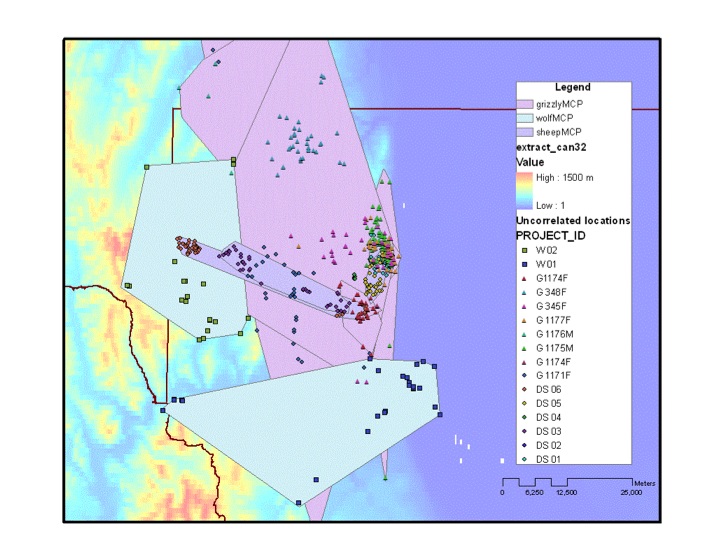
Decribing the animal’s movements certainly start with the estimation of the individual home ranges of the collared animals. In this exercise, I present the minimum convex polygon as a measure of the home range, partly because the estimates fixed kernel home ranges tended to be clustered, despite the elimination of autocorrelated data. Redoing this analysis after all the locations will be available will likely solve this problem.


Qualitative insights on home range overlap
...I wish I could write Quantitative insights! After being doomed with one problem after another with GIS program (ArcMap, ArcView, Quantum GIS, Grass), I decided to leave the % overlap to an ulterior analysis, and for now concentrate on the qualitative description of home range. Based on the home range map:
• Wolves in the Rat River pack (W01) do not overlap with the home range of any Dall’s sheep monitored in our study, however do overlap with the range of three grizzly bears.
• Wolves in the Fish Creek pack (W02) do overlap with Dall’s sheep in the western part of the study area, but do also overlap with two grizzly bears.
• Dall’s sheep and grizzly bears have the highest degree of overlap, particularly in the eastern part of the study area (which corresponds to the Goodenough mountain)
A test of correlation between the locations (Pearson's correlation test) demonstrated that 15 associations between grizzly bears and Dall's sheep were positive (p<0.01).
For a more quantitative analysis, please go to Dynamic Interactions


