Results from Data Analysis
How much Land are we Protecting? How much of it is forested?
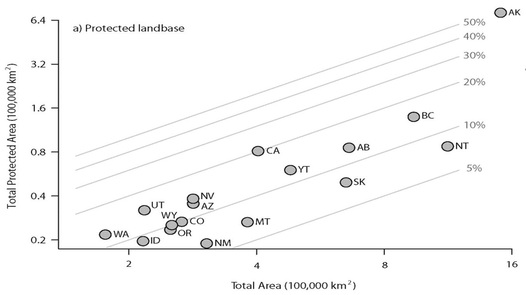
 Figure 1a. Total area and total protected landbase by jurisdiction.
In figure 1a we can see how much land each jurisdiction is protecting. For example we can see that Alaska has an area of approximately 1,400,000 square kilometers while it is protecting about 50% of that land at just less than 700,000 square kilometers. The Yukon Territory is protecting approximately 12% of its area at total of 40,000 square kilometers.
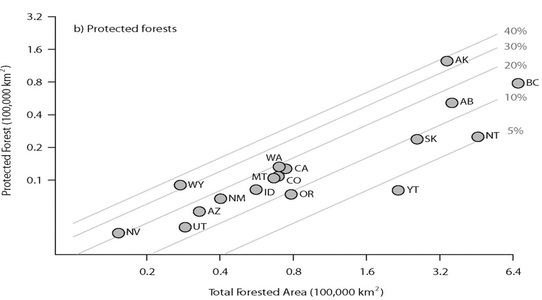
 Figure 1b. Total forested area and total protected forest by jurisdiction.
In figure 1b can be compared to the figure above. It allows us to see how much forest is contained in each jurisdiction and how much of that forest is in protected areas. For example, we can see that Alaska is protecting approximately 40% of its forest and the Yukon has dropped below 5% of its forest.
Are we currently protecting populations at an adequate level?
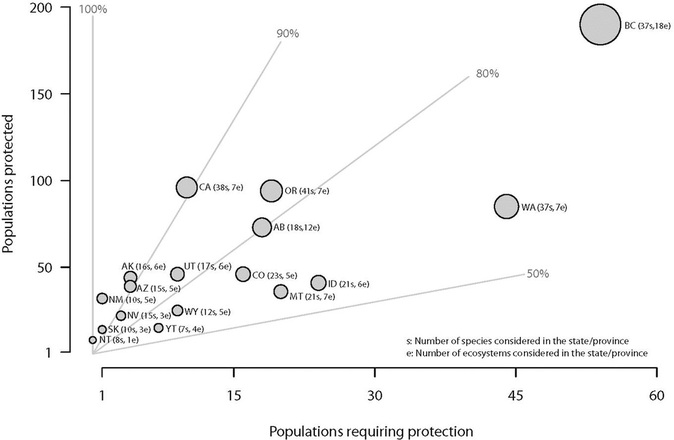
 Figure 2. Comparison of populations requiring protection with those that are protected by jurisdiction.
Figure 2 allows us to see the number of populations that are protected versus the populations requiring protection by jurisdiction . The symbols are proportional to the number of species analysed for the jurisdiction. To the right of the jurisdiction label in brackets are the number of species and ecosystems included in the analysis. For example, British Columbia has 36 species, is protecting 190 populations but has 54 populations still requiring protection. California and Oregon contain the most amount of species, 38 and 41 respectively. California is protecting the vast majority of their populations with only about 10 populations still requiring protection.
Are we currently effectively protecting our species?
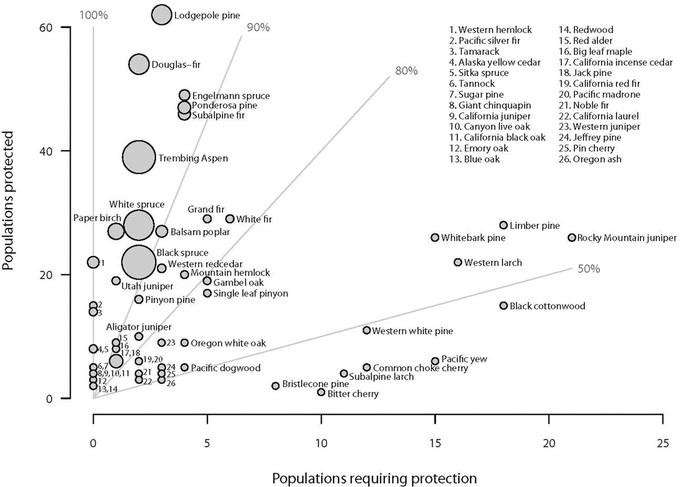
 Figure 3. Comparison of populations requiring protection to those protected by species.
Figure 3 has the same axes as the one above but is looking at individual species and their populations. The symbols are proportional to the range size of the species in the study area. The species in the bottom right section are those that are requiring the most protection. Species in this area that are of the most interest are; Whitebark pine which is endangered as well as Pacific yew and Western white pine which are both listed as near threatened. The species in the top left section are those that have a lot of populations protected such as Lodgepole pine, Douglas-fir, White and Black spruce. It seems that the species that have the least amount of protection are those that don't have a large range such as the cherry species while the species that have the most populations protected are those with the larger ranges.