Methods Example: Washington & Olympic National Park
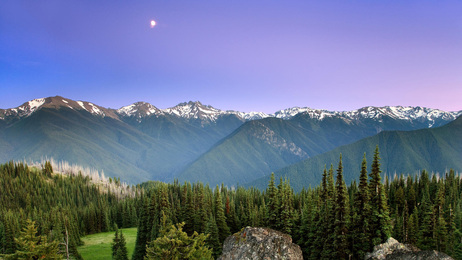 Moonrise over Olympic National Park, Source: wallpapers5.com
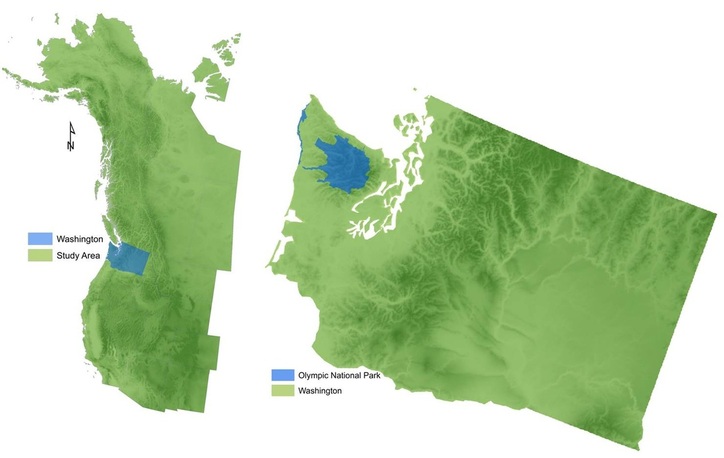
Olympic National Park is located in Washington state on the Olympic peninsula and has an area of 373,380 ha. Designated as a national park in 1938, it is listed as IUCN category II. The smaller coastal portion of the park is separated from the larger, inland portion. The park contains a variety of bioclimatic zones including the Pacific coastline, glaciated alpine areas, the west of the park contains temperate rainforest and the east contains a drier forest. Ninety-five percent of the park is designated wilderness and the park is used mainly for recreation. Saltwater surrounds the park on three sides and thus it is somewhat of an ecological island. The area has many endemic species such as the Olympic marmot and the world's largest unmanaged population of Roosevelt elk. Trees of record size have been found in the western valleys in the temperate rainforest and valleys on the eastern side of the park have notable old-growth forests (National Parks Conservation Association, 2013).
Location of Washington and Olympic National Park
Methods
Example: Calculating the amount of each land cover class in a jurisdiction and that jurisdictions protected areas
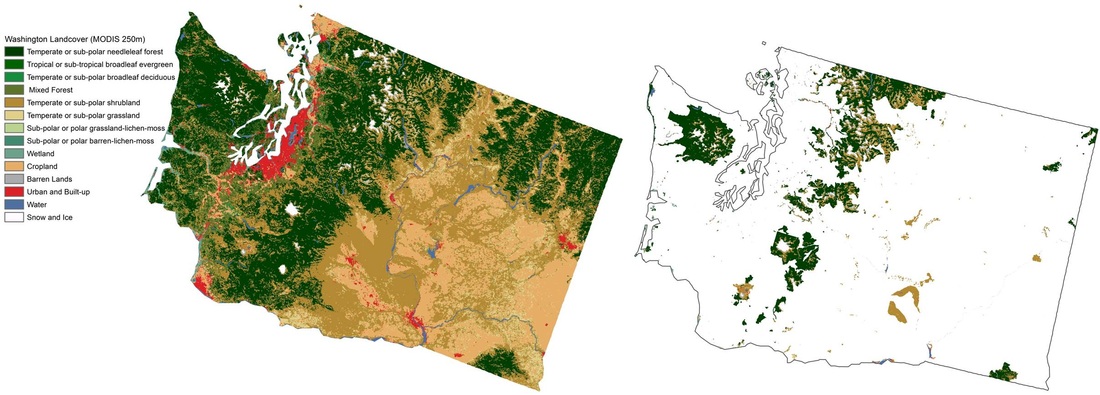
The first step in this analysis is to extract the land cover of the state (CCRS, 2010) and the land cover that is contained within the protected areas. The master tables for Protected Areas and Western North America shown on the Methods & Data page can then be read into R programming where the total square kilometers of each land cover class in the state and in protected areas can be calculated from converting the number of 250m pixels to number of square kilometers. This allows us to see exactly how much of each land cover class exists in Washington, how much land is being protected and what exactly is being protected. For the purposes of this study we want to know how much forest exists in the state and how much of the forested land is currently being protected. The output tables from this can be seen below (Table 1 and Table 2). We can sum Table 1 and Table 2 to determine how much land is being protected in Washington compared to their landbase. We can use Table 2 to determine how much of Washington's forested land is being protected compared to how much forest the state contains. Washington is protecting approximately 12% of their landbase and protecting approximately 19% of their forests. These results can be seen in Figure 1a and 1b on the Results page, this has been done for every jurisdiction in the study area.
Example: species-forest ecosystem conservation gap analysis
To conduct the gap analysis portion of this research there are 6 main steps involved:
1. Query data related to Washington and Olympic National Park from master tables created:
From the master tables created (Table 1 and 2 on the Methods & Data page) we can use R to query for the data that pertains to a particular jurisdiction and protected area. Each protected area has a particular ID number associated with it therefore we can use this number to obtain the data related to this protected area. We can also query out all the data that pertains to Washington. This is all used in further analysis to allow us to determine if species and forest ecosystems (seedzones) are adequately protected in particular areas.
2. Summarize species in protected areas and jurisdictions:
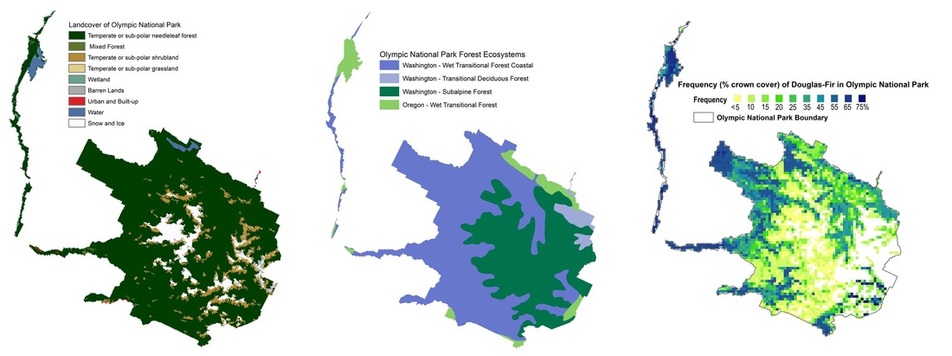
We can overlay the species distribution models with the master files created for the protected areas and the full study area (Table 3 and 4 above) to determine how much of a species-forest ecosystem combination occurs inside a protected area (Table 5 below) as well as how much of a species range exists in a state by land cover class (Table 6 below). In this example we are looking at Douglas-Fir in Olympic National Park and Washington.
We can overlay the species distribution models with the master files created for the protected areas and the full study area (Table 3 and 4 above) to determine how much of a species-forest ecosystem combination occurs inside a protected area (Table 5 below) as well as how much of a species range exists in a state by land cover class (Table 6 below). In this example we are looking at Douglas-Fir in Olympic National Park and Washington.
3. Calculate coverage of species and determine protection in a protected area :
The data created in Table 5 allows us to determine how many hectares of a species exist within a forest ecosystem inside a protected area. Under current conditions we only want to look at areas that are considered forested. Hectares is calculated by dividing the cumulative cover by 1000 and multiplying this by 6.25. Cumulative cover is divided by 1000 because it is actually the frequency of the species (% crown cover) and when stored in ASCII format it cannot contain decimals so we need to divide to bring it to the true value. It is then multiplied by 6.25 because the land cover data on which everything is overlaid is in 250m resolution and therefore every pixel is equal to 6.25 ha. This value is then stored in the HECTARES column (seen below in Table 7).
We can then determine if the species-forest ecosystem combination is adequately protected. For the protected area to qualify as a reserve for a species-forest ecosystem combination it should be large enough to ensure adequate genetic variability and functioning of mating systems of tree species, a cumulative cover of 10 ha is likely to contain a population size large enough for this (Hamann et al., 2005). Therefore if HECTARES is greater than 10 the species-forest ecosystem combination is considered protected within this protected area and a "YES" is assigned to the STANDARD column. If it is less than 10 ha the STANDARD column would be "NO". In this case all the species-forest ecosystem combinations for Douglas-Fir are protected within Olympic National Park (seen below in Table 7).
4. Calculate coverage of species-forest ecosystem combination in the study area :
When calculating the total coverage of a species-forest ecosystem combination in a jurisdiction under current conditions we only consider those areas that classed as forested. The total hectares of the species-forest ecosystem combination is calculated, the HECTARES column below in Table 8. This column is then summed to determine the total hectares of that species range. The HECTARES column is divided by the sum of the total hectares and multiplied by 100 to obtain the percent of the hectare coverage, this value in then stored in the H.Perc column. In the CUM.COVER column we add the previous H.Perc value to the CUM.COVER value, we then put this in order and don't consider values beyond the 99% point in further analysis to avoid placing responsibility on a jurisdiction that only contains very small values of a species-ecosystem combination for its protection.
When calculating the total coverage of a species-forest ecosystem combination in a jurisdiction under current conditions we only consider those areas that classed as forested. The total hectares of the species-forest ecosystem combination is calculated, the HECTARES column below in Table 8. This column is then summed to determine the total hectares of that species range. The HECTARES column is divided by the sum of the total hectares and multiplied by 100 to obtain the percent of the hectare coverage, this value in then stored in the H.Perc column. In the CUM.COVER column we add the previous H.Perc value to the CUM.COVER value, we then put this in order and don't consider values beyond the 99% point in further analysis to avoid placing responsibility on a jurisdiction that only contains very small values of a species-ecosystem combination for its protection.
5. Sum the total hectares of forest ecosystems of a species:
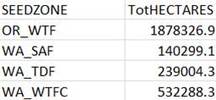
We can then sum the HECTARES by forest ecosystems to provide us with a total area of the coverage of a species in this forest ecosystem. This is only done for the forest ecosystems that make up 99% of the coverage of the species-forest ecosystem combination. Below in Table 9 you can see the total hectares of Douglas-Fir that occurs within the forest ecosystems that also exist in Olympic National Park.
We can then sum the HECTARES by forest ecosystems to provide us with a total area of the coverage of a species in this forest ecosystem. This is only done for the forest ecosystems that make up 99% of the coverage of the species-forest ecosystem combination. Below in Table 9 you can see the total hectares of Douglas-Fir that occurs within the forest ecosystems that also exist in Olympic National Park.
6. Determine protection of a species-forest ecosystem combination (population):
For the final step in the gap analysis we can use the data from the previous steps to determine if populations (species-forest ecosystems) are adequately protected or not. First we sum the hectares of the species-forest ecosystem combination by protected area. We then calculate the proportion (%) of the population that is protected by dividing our sum of hectares by the total hectares multiplied by 100, this is stored in the TotHECTARES column in the table shown below. We then determine how many protected areas meet the 10 ha standard for protection for the population and this is stored in the PA.10HECTARE column. For example, in the table below for the Douglas-Fir and Oregon-Wet Transitional Forest combination there are 125 protected areas that meet the protection standard. Populations that have more than 3 protected areas meeting the standard of 10 ha are considered to be protected, those with less than 3 meeting this standard are not considered to be protected and are conservation gaps.
For the final step in the gap analysis we can use the data from the previous steps to determine if populations (species-forest ecosystems) are adequately protected or not. First we sum the hectares of the species-forest ecosystem combination by protected area. We then calculate the proportion (%) of the population that is protected by dividing our sum of hectares by the total hectares multiplied by 100, this is stored in the TotHECTARES column in the table shown below. We then determine how many protected areas meet the 10 ha standard for protection for the population and this is stored in the PA.10HECTARE column. For example, in the table below for the Douglas-Fir and Oregon-Wet Transitional Forest combination there are 125 protected areas that meet the protection standard. Populations that have more than 3 protected areas meeting the standard of 10 ha are considered to be protected, those with less than 3 meeting this standard are not considered to be protected and are conservation gaps.
Conducting the conservation gap analysis for future time periods
Under future climate scenarios we use species distribution models for the 58 species in the study that have been modeled based on climate variables in the overlay analysis. The only difference in analysis being that we only cut out only the land cover classes of barren, glacier/ice, water and urban. We do this because under future conditions any other areas may potentially be able to support forest.
