How do we determine the protected status of species and populations?
Study Area
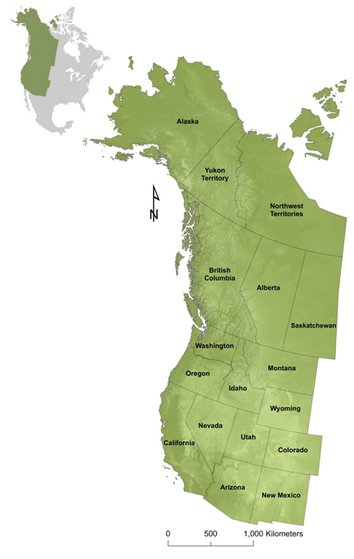
 Figure 1. Western North America study area.
The study area (Figure 1) is the western portion of North America. It includes 17 jurisdictions: 3 Canadian provinces, 2 northern Canadian territories, 11 of the contiguous American states as well as the state of Alaska in the north.
Overlay Analysis
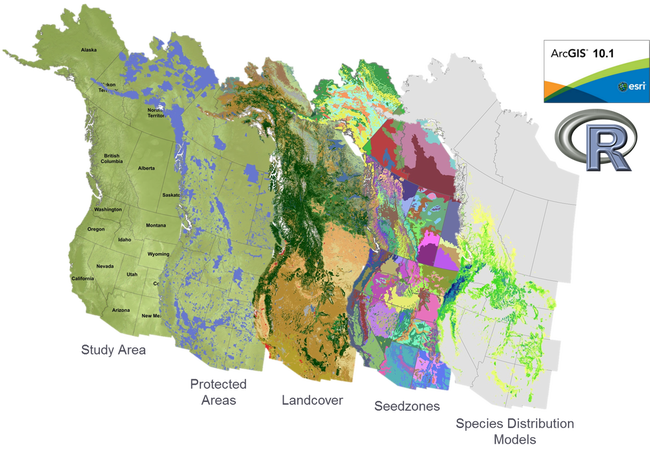
To assess the current protected status of species and populations we perform an overlay analysis of multiple spatial layers. This is completed using a combination of ArcGIS (ESRI, 2012) and R programming (R Core Team, 2013). All of the files overlayed are stored in ASCII format which ArcGIS reads as an ESRI grid format. Initially we overlay the land cover layer (CCRS, 2010) which is at a 250m resolution with the study area and the protected areas layer. This allows us to extract how much land is protected in each jurisdiction, as well as how much forest exist in each jurisdiction and how much forest they are protecting. Next we determine how well populations (defined by the species-seedzone combination) and species are protected under current conditions, this is done by overlaying all of the layers in Figure 2. The un-habitable areas are removed from the analysis by removing the land cover that is classed as water, ice/glacier, and barren. We can then calculate the cumulative cover of species and amount of populations that fall within protected areas. This in turn allows us to determine who is responsible for protecting which populations and species based on the cumulative cover contained in their jurisdictions.
Please refer to the Methods Example page for a more in depth description of these methods using one protected area and one species.
Please refer to the Species List page for a list of the forest tree species involved in this analysis.
Please refer to the Methods Example page for a more in depth description of these methods using one protected area and one species.
Please refer to the Species List page for a list of the forest tree species involved in this analysis.
Data Created From This Analysis
Western North America Master Table
Western North America Protected Area Master Table
Table 1 and 2 were created from the overlay analysis of the study area, protected areas, land cover and the seedzones (referred to as Forest Ecosystems). They also contain the projected seedzone (P_SEEDZONE) for future analysis under climate change conditions. They are based on coordinates and every coordinate has a unique merge ID associated with its location to ensure merging of tables is accurate. These tables were then used to create the tables for each species to determine which protected area they fell into as well as which seedzone. They are used in further analysis for merging with species distribution data to enable determination of where species are protected and how well they are protected under current and future conditions.
Species Data - Example Table of Douglas-fir coverage in Western North America
douglas-fir coverage in protected areas
Table 3 and 4 were created by overlaying the species distribution models with the master tables to enable calculating the cumulative cover of the species in each seedzone. Table 3 is an overall coverage of the whole distribution of the species while Table 4 is the coverage that is contained within protected areas. These tables exist for every species in the study for the current time period, the 2020s, 2050s and 2080s. They can then be used to perform calculations to determine which populations and species are adequately protected and which require protection by jurisdiction, population and species.
Table with calculations determining protection level - Example of Douglas-fir
Table 5 show the results of calculations that determine whether a species and population are adequately protected or not. The PA.10HECTARE column is the number of protected areas that meet the standard (10 ha in a protected area) set for protection. For a species or population to be protected it has to have at least a 10 ha cumulative cover in at least 3 protected areas. This also contains the proportion of the total population that exists in this seedzone. This can then be further broken down by jurisdiction to determine which species or populations a jurisdiction is adequately protecting and which they need to consider providing better protection for. These tables exist for every species in the study for the current time and future time periods.


