Other climate data  |  Species range maps  |  Other data

Historical and projected climate data for North America (ClimateNA)

On this page you can download the ClimateNA software and more than 10,000 high-resolution climate grids (1 km) for historical climate (1901-2020) in monthly, annual, decadal, and 30-year steps and projected future climate (2020s, 2050s, 2080s) based on CMIP6 multi-model projections.

The database includes monthly base variables (Tmin, Tmax, Tave & Prec) as well as economically or biologically relevant (bioclim) variables such as growing and chilling degree days, beginning and end of frost free preiod, heating and cooling degree days, Hargrave's climate moisture deficit and reference evaporation, and many more.

The grids are based on PRISM interpolations by Chris Daly, which the ClimateNA software downscales using high-resolution DEMs in conjunction with local environmental lapse-rates. The software can also provide scale-free point estimates of climate variables for user-provided latitude, longitude and elevation coordinates.

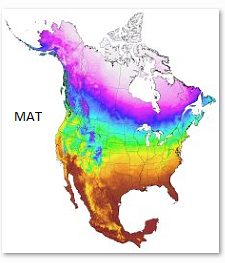
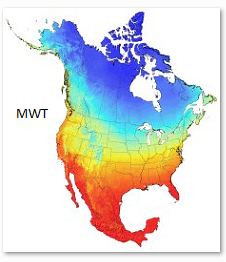
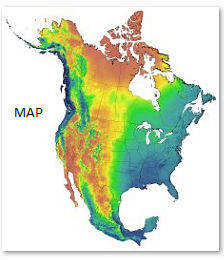
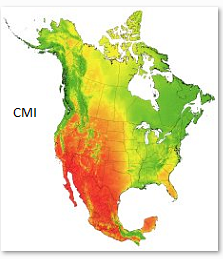
Gridded data at 1 km resolution are available from the tables on this page, but you may also explore some sample grids visually below: click on a thumbnails below and then zoom in or out of different areas ( Zoom tool ).

MAT TaveDJF MAP CMI

 
Downloads and References
 

The ClimateNA software does not require installation. Download, unzip, and double click the executable file ClimateNA.exe. The program should run on all versions of Windows. If you receive the error message "COMCTL32.OCX missing", you have to install these libraryfiles. The program also runs on Linux, Unix and Mac systems with the free software Wine or MacPorts/Wine).

Picture
ClimateNA v6.40a - covers North America and includes CMIP6 projections corresponding to IPCC Assessment Report 6 (2021) and CRU-TS 4.05 historical data from 1901 to 2020.

      Video tutorials on how to use the software to obtain climate data for sample locations, or to produce climate grids for a study area.

ClimateNA v6.40a is an older software version that corresponds exactly to the methods described our 2016 paper (referenced below). It is well tested and internally used in my own lab for consistency with work done since 2016. However, the ClimateNA software is under active development, with new features, new historical data, and other improvements constantly being added. Get the latest version here: http://climatena.ca.

Picture
Wang, T., Hamann, A. Spittlehouse, D.L. and Carroll, C. 2016. Locally downscaled and spatially customizable climate data for historical and future periods for North America. PLoS One 11: e0156720.


Gridded data at 1km resolution

This dataset below was created by Carlos Carroll for AdaptWest, funded by the Wilburforce foundation. The gridded data were generated with the ClimateNA v7.30 software package. The download packages are zip files of either standard monthly variables (Tmin, Tmax, Tave, Prec) or derived bioclimatic variables (Bioclim) for historical and projected climate data. Unzip the downloaded packages to extract geoTIFF files compatible with most GIS applications in Lambert Azimuthal Equal Area projection. See the "Readme.txt" for further details and "Citation.txt" for how to cite usage of this database:

Readme file
Elevation reference
Citation
Readme.txt: CSV format geoTIFF: ASCII format Citation.txt: ASCII format

Historical 30-year climate normal periods
1961-1990 Bioclim: CSV format, Monthly: CSV format 1971-2000 Bioclim: CSV format, Monthly: CSV format 1981-2010 Bioclim: CSV format, Monthly: CSV format
1991-2020 Bioclim: CSV format, Monthly: CSV format (as a representation of current climate use the SSP2-2020s* projection below)

Future 30-year climate normal periods
Average ensemble scenarios1
33 Bioclimatic variables
48 Monthly variables
SSP1 (+2.6 W/m2) - Sustainability focus2 2020s3: CSV format, 2050s: ASCII format, 2080s: ASCII format 2020s: CSV format, 2050s: ASCII format, 2080s: ASCII format
SSP2 (+4.5 W/m2) - Middle of the road 2020s*: CSV format, 2050s: ASCII format, 2080s: ASCII format 2020s*: CSV format, 2050s: ASCII format, 2080s: ASCII format
SSP3 (+7.0 W/m2) - Regional rivalry 2020s: CSV format, 2050s: ASCII format, 2080s: ASCII format 2020s: CSV format, 2050s: ASCII format, 2080s: ASCII format
SSP5 (+8.5 W/m2) - Fossil fuel development 2020s: CSV format, 2050s: ASCII format, 2080s: ASCII format 2020s: CSV format, 2050s: ASCII format, 2080s: ASCII format
   1) The ensemble projections are averages across 8 CMIP6 models (ACC, CNRM, EC, GFDL, GISS, MIR, MPI and MRI) that were chosen
     based on a variety of quality criteria and representativeness. For details on GCM selection, see Mahoney et al. (2022).
   2) Average projected global warming by the 2080s for different Shared Socioeconomic Pathways (SSP) scenarios:
       SSP1-2.6: 1.5-2.0°C; SSP2-4.5: 2.5-3.0°C; SSP3-7.0: 3.5-4.0°C; SSP5-5.8: 4.0-5.0°C.
   3) Projections for 30-year normal periods: 2020s: 2011-2040, 2050s: 2041-2070, 2080s: 2071-2100.
    *) SSP2-2020s is a good choice to represent current climate (midpoint of "middle of the road" climate normal estimate).


Future 20-year climate averages4
Average ensemble scenarios
33 Bioclimatic variables
48 Monthly variables
SSP1 (+2.6 W/m2) - Sustainability focus 20304: CSV format, 2050: ASCII format, 2070: ASCII format, 2090: ASCII format 2030: CSV format, 2050: ASCII format, 2070: ASCII format, 2090: ASCII format
SSP2 (+4.5 W/m2) - Middle of the road 2030: CSV format, 2050: ASCII format, 2070: ASCII format, 2090: ASCII format 2030: CSV format, 2050: ASCII format, 2070: ASCII format, 2090: ASCII format
SSP3 (+7.0 W/m2) - Regional rivalry 2030: CSV format, 2050: ASCII format, 2070: ASCII format, 2090: ASCII format 2030: CSV format, 2050: ASCII format, 2070: ASCII format, 2090: ASCII format
SSP5 (+8.5 W/m2) - Fossil fuel development 2030: CSV format, 2050: ASCII format, 2070: ASCII format, 2090: ASCII format 2030: CSV format, 2050: ASCII format, 2070: ASCII format, 2090: ASCII format
   4) For climate change adaptation planning, 30-year time steps can be quite long. We therefore also provide 20-year averages that center around the years: 2030: 2021-2040, 2050: 2041-2060, 2070: 2061-2080, and 2090: 2081-2100.


Scenario selection to quantify uncertainty for different regions of North America

If you want to quantify uncertainty in future projections, you need to work with a selection of multiple, individual models. This is easily done with the provided software for locations of interest (see video tutorial), and in addition we provide gridded data for nine high quality and representative AOGCMs.

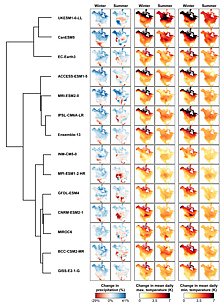
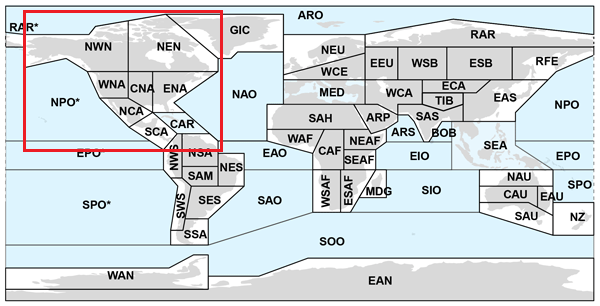
To help with the selection of a representative set of models for different regions of North America (or for the entire continent), we used the Katsavounidis-Kuo-Zhang (KKZ) algorithm, which selects an optimally representative set of future projections for different IPCC climate reference regions considering multiple climate variables (click on left panel dendrogram to visualize similarity among models):

aogcms     IPCCregions

A common approach is to select a median, a pessimistic and an optimistic projection, i.e., a subset size of 3. For example, to assess uncertainty of future projections in the Northwest North America region (NWN) with a 3-model ensemble, you would choose the models: CNRM (median), EC (optimistic), and ACC (pessimistic) from the table below (compare with the dendrogram above). More models (rows 4 to 8) will provide increasingly better represenation of uncertainty in future predictions in multivariate space.

To include the sensitive "outlier" model UKES in the model selection process, use the lower portion of the table. If UKES is included, this scenario will almost always be picked second, as the most "pessimistic" model of global warming. UKES is not a very likely outcome, but if you work with a larger ensemble, you may include it as one possible outcome. For details on the GCM selection process, see Mahoney et al. (2022).

Subset size
IPCC climate reference region1
North America
NEN1
NWN
WNA
CNA
ENA
NCA
SCA
Excluding UKESM1-0-LL
1 CNRM2 CNRM MRI MRI GISS MRI GISS CNRM
2 EC EC MPI GFDL ACC GFDL ACC GFDL
3 GFDL ACC GISS MIR MRI EC MIR EC
4 MRI MPI MIR CNRM GFDL MIR EC GISS
5 ACC GISS EC GISS CNRM CNRM GFDL MIR
6 GISS MIR CNRM EC EC MPI MPI ACC
7 MPI MRI GFDL MPI MIR ACC MRI MRI
8 MIR GFDL ACC ACC MPI GISS CNRM MPI
Including UKESM1-0-LL
1 CNRM CNRM MRI ACC EC MRI GISS CNRM
2 UKES UKES UKES UKES UKES UKES UKES UKES
3 EC EC MPI CNRM GFDL GFDL ACC GFDL
4 MPI MPI GISS GFDL MRI EC MIR EC
5 MRI ACC EC MIR MIR MIR EC MRI
6 ACC GISS CNRM EC GISS CNRM GFDL GISS
7 GISS MRI MIR GISS MPI MPI MPI MIR
8 GFDL MIR GFDL MPI ACC ACC CNRM ACC
9 MIR GFDL ACC MRI CNRM GISS MRI MPI
   1) IPCC region abbreviations are: NEN, N.E.North-America; NWN, N.W.North-America; WNA, W.North-America; CNA, Central North-America;
       ENA, E.North-America; NCA, N.Central-America; SCA, S.Central-America.

   2) Model abbreviations are: ACC, ACCESS-ESM1-5; CNRM, CNRM-ESM2-1; EC, EC-Earth3; GFDL, GFDL-ESM4; GISS, GISS-E2-1-G; MIR, MIROC6;
       MPI, MPI-ESM1-2-HR; MRI, MRI-ESM2-0; and UKES, UKESM1-0-LL.


Individual model downloads at 1km resolution

ACCESS-ESM1-5 (ACC)
SSP scenario1
33 Bioclimatic variables
48 Monthly variables
SSP1 (+2.6 W/m2) - Sustainability focus 2020s2: CSV format, 2050s: ASCII format, 2080s: ASCII format 2020s: CSV format, 2050s: ASCII format, 2080s: ASCII format
SSP2 (+4.5 W/m2) - Middle of the road 2020s: CSV format, 2050s: ASCII format, 2080s: ASCII format 2020s: CSV format, 2050s: ASCII format, 2080s: ASCII format
SSP3 (+7.0 W/m2) - Regional rivalry 2020s: CSV format, 2050s: ASCII format, 2080s: ASCII format 2020s: CSV format, 2050s: ASCII format, 2080s: ASCII format
SSP5 (+8.5 W/m2) - Fossil fuel development 2020s: CSV format, 2050s: ASCII format, 2080s: ASCII format 2020s: CSV format, 2050s: ASCII format, 2080s: ASCII format
   1) Average projected global warming by the 2080s for different Shared Socioeconomic Pathways (SSP) scenarios:
       SSP1-2.6: 1.5-2.0°C; SSP2-4.5: 2.5-3.0°C; SSP3-7.0: 3.5-4.0°C; SSP5-5.8: 4.0-5.0°C.
   2) Projections for 30-year normal periods: 2020s: 2011-2040, 2050s: 2041-2070, 2080s: 2071-2100.


CNRM-ESM2-1 (CNRM)
SSP scenario
33 Bioclimatic variables
48 Monthly variables
SSP1 (+2.6 W/m2) - Sustainability focus 2020s: CSV format, 2050s: ASCII format, 2080s: ASCII format 2020s: CSV format, 2050s: ASCII format, 2080s: ASCII format
SSP2 (+4.5 W/m2) - Middle of the road 2020s: CSV format, 2050s: ASCII format, 2080s: ASCII format 2020s: CSV format, 2050s: ASCII format, 2080s: ASCII format
SSP3 (+7.0 W/m2) - Regional rivalry 2020s: CSV format, 2050s: ASCII format, 2080s: ASCII format 2020s: CSV format, 2050s: ASCII format, 2080s: ASCII format
SSP5 (+8.5 W/m2) - Fossil fuel development 2020s: CSV format, 2050s: ASCII format, 2080s: ASCII format 2020s: CSV format, 2050s: ASCII format, 2080s: ASCII format


EC-Earth3 (EC)
SSP scenario
33 Bioclimatic variables
48 Monthly variables
SSP1 (+2.6 W/m2) - Sustainability focus 2020s: CSV format, 2050s: ASCII format, 2080s: ASCII format 2020s: CSV format, 2050s: ASCII format, 2080s: ASCII format
SSP2 (+4.5 W/m2) - Middle of the road 2020s: CSV format, 2050s: ASCII format, 2080s: ASCII format 2020s: CSV format, 2050s: ASCII format, 2080s: ASCII format
SSP3 (+7.0 W/m2) - Regional rivalry 2020s: CSV format, 2050s: ASCII format, 2080s: ASCII format 2020s: CSV format, 2050s: ASCII format, 2080s: ASCII format
SSP5 (+8.5 W/m2) - Fossil fuel development 2020s: CSV format, 2050s: ASCII format, 2080s: ASCII format 2020s: CSV format, 2050s: ASCII format, 2080s: ASCII format


GFDL-ESM4 (GFDL)
SSP scenario
33 Bioclimatic variables
48 Monthly variables
SSP1 (+2.6 W/m2) - Sustainability focus 2020s: CSV format, 2050s: ASCII format, 2080s: ASCII format 2020s: CSV format, 2050s: ASCII format, 2080s: ASCII format
SSP2 (+4.5 W/m2) - Middle of the road 2020s: CSV format, 2050s: ASCII format, 2080s: ASCII format 2020s: CSV format, 2050s: ASCII format, 2080s: ASCII format
SSP3 (+7.0 W/m2) - Regional rivalry 2020s: CSV format, 2050s: ASCII format, 2080s: ASCII format 2020s: CSV format, 2050s: ASCII format, 2080s: ASCII format
SSP5 (+8.5 W/m2) - Fossil fuel development 2020s: CSV format, 2050s: ASCII format, 2080s: ASCII format 2020s: CSV format, 2050s: ASCII format, 2080s: ASCII format


GISS-E2-1-G (GISS)
SSP scenario
33 Bioclimatic variables
48 Monthly variables
SSP1 (+2.6 W/m2) - Sustainability focus 2020s: CSV format, 2050s: ASCII format, 2080s: ASCII format 2020s: CSV format, 2050s: ASCII format, 2080s: ASCII format
SSP2 (+4.5 W/m2) - Middle of the road 2020s: CSV format, 2050s: ASCII format, 2080s: ASCII format 2020s: CSV format, 2050s: ASCII format, 2080s: ASCII format
SSP3 (+7.0 W/m2) - Regional rivalry 2020s: CSV format, 2050s: ASCII format, 2080s: ASCII format 2020s: CSV format, 2050s: ASCII format, 2080s: ASCII format
SSP5 (+8.5 W/m2) - Fossil fuel development 2020s: CSV format, 2050s: ASCII format, 2080s: ASCII format 2020s: CSV format, 2050s: ASCII format, 2080s: ASCII format


MIROC6 (MIR)
SSP scenario
33 Bioclimatic variables
48 Monthly variables
SSP1 (+2.6 W/m2) - Sustainability focus 2020s: CSV format, 2050s: ASCII format, 2080s: ASCII format 2020s: CSV format, 2050s: ASCII format, 2080s: ASCII format
SSP2 (+4.5 W/m2) - Middle of the road 2020s: CSV format, 2050s: ASCII format, 2080s: ASCII format 2020s: CSV format, 2050s: ASCII format, 2080s: ASCII format
SSP3 (+7.0 W/m2) - Regional rivalry 2020s: CSV format, 2050s: ASCII format, 2080s: ASCII format 2020s: CSV format, 2050s: ASCII format, 2080s: ASCII format
SSP5 (+8.5 W/m2) - Fossil fuel development 2020s: CSV format, 2050s: ASCII format, 2080s: ASCII format 2020s: CSV format, 2050s: ASCII format, 2080s: ASCII format


MPI-ESM1-2-HR (MPI)
SSP scenario
33 Bioclimatic variables
48 Monthly variables
SSP1 (+2.6 W/m2) - Sustainability focus 2020s: CSV format, 2050s: ASCII format, 2080s: ASCII format 2020s: CSV format, 2050s: ASCII format, 2080s: ASCII format
SSP2 (+4.5 W/m2) - Middle of the road 2020s: CSV format, 2050s: ASCII format, 2080s: ASCII format 2020s: CSV format, 2050s: ASCII format, 2080s: ASCII format
SSP3 (+7.0 W/m2) - Regional rivalry 2020s: CSV format, 2050s: ASCII format, 2080s: ASCII format 2020s: CSV format, 2050s: ASCII format, 2080s: ASCII format
SSP5 (+8.5 W/m2) - Fossil fuel development 2020s: CSV format, 2050s: ASCII format, 2080s: ASCII format 2020s: CSV format, 2050s: ASCII format, 2080s: ASCII format


MRI-ESM2-0 (MRI)
SSP scenario
33 Bioclimatic variables
48 Monthly variables
SSP1 (+2.6 W/m2) - Sustainability focus 2020s: CSV format, 2050s: ASCII format, 2080s: ASCII format 2020s: CSV format, 2050s: ASCII format, 2080s: ASCII format
SSP2 (+4.5 W/m2) - Middle of the road 2020s: CSV format, 2050s: ASCII format, 2080s: ASCII format 2020s: CSV format, 2050s: ASCII format, 2080s: ASCII format
SSP3 (+7.0 W/m2) - Regional rivalry 2020s: CSV format, 2050s: ASCII format, 2080s: ASCII format 2020s: CSV format, 2050s: ASCII format, 2080s: ASCII format
SSP5 (+8.5 W/m2) - Fossil fuel development 2020s: CSV format, 2050s: ASCII format, 2080s: ASCII format 2020s: CSV format, 2050s: ASCII format, 2080s: ASCII format


UKESM1-0-LL (UKES)
SSP scenario
33 Bioclimatic variables
48 Monthly variables
SSP1 (+2.6 W/m2) - Sustainability focus 2020s: CSV format, 2050s: ASCII format, 2080s: ASCII format 2020s: CSV format, 2050s: ASCII format, 2080s: ASCII format
SSP2 (+4.5 W/m2) - Middle of the road 2020s: CSV format, 2050s: ASCII format, 2080s: ASCII format 2020s: CSV format, 2050s: ASCII format, 2080s: ASCII format
SSP3 (+7.0 W/m2) - Regional rivalry 2020s: CSV format, 2050s: ASCII format, 2080s: ASCII format 2020s: CSV format, 2050s: ASCII format, 2080s: ASCII format
SSP5 (+8.5 W/m2) - Fossil fuel development 2020s: CSV format, 2050s: ASCII format, 2080s: ASCII format 2020s: CSV format, 2050s: ASCII format, 2080s: ASCII format

 
References
 

Picture
Mahoney, C.R., Wang, T., Hamann, A., Cannon, A.J. 2022. A CMIP6 ensemble for downscaled monthly climate normals over North America. International Journal of Climatology 42: 5871-5891.
Picture
Wang, T., Hamann, A. Spittlehouse, D.L. and Carroll, C. 2016. Locally downscaled and spatially customizable climate data for historical and future periods for North America. PLoS One 11: e0156720.
Picture
Hamann, A. and Wang, T., Spittlehouse, D.L., and Murdock, T.Q. 2013. A comprehensive, high-resolution database of historical and projected climate surfaces for western North America. Bulletin of the American Meteorological Society 94: 13071309.


Links to depreciated CMIP5 and CMIP3-based data sets
 

You can still access older, depreciated datasets that correspond to the 5th IPCC Assessment Report (2013) and are based on the CMIP5 multimodel dataset here. Similarly the dataset corresponding to the 4th IPCC Assessment Report (2009) can still be downloaded here.