
A whole brain, region by region
Rotate a whole-brain reconstruction and examine its Desikan–Killiany–Tourville (DKT) atlas labels. Toggle either hemisphere, separate the two sides, switch between lobe and individual region colours, and click any visible structure to identify it. Interactive visualization developed by Ben Yang.
DKT cortical atlas with subcortical structures. Drag to orbit, scroll or pinch to zoom, and use the control panel to change what is shown. The model runs entirely in your browser.
Interactive visualization developed by Ben Yang
Hippocampal subfields & amygdala subnuclei
Scroll through the high-resolution coronal slices and toggle the manual segmentation, or watch the same structures turn in 3D and drag the model to take control. Visualization developed by Ethan Hernandez.
High-resolution fast spin-echo (FSE) showing the whole coronal section with manually delineated bilateral hippocampal subfields and amygdala subnuclei. Acquired at 0.34 × 1.0 × 0.26 mm and resampled to 0.7 mm in-plane for the web, with contrast enhancement (edge-preserving denoising and adaptive histogram equalisation). Displayed as an interactive reconstruction you can scroll and rotate.
Visualization developed by Ethan
Whole-brain diffusion tractography
Fibre pathways reconstructed from diffusion MRI and coloured by their orientation. The model turns on its own. Toggle each hemisphere, thin the fibres, adjust the opacity, and drag to take control. Visualization developed by Gabriel Nasr.
Visualization developed by Gabriel
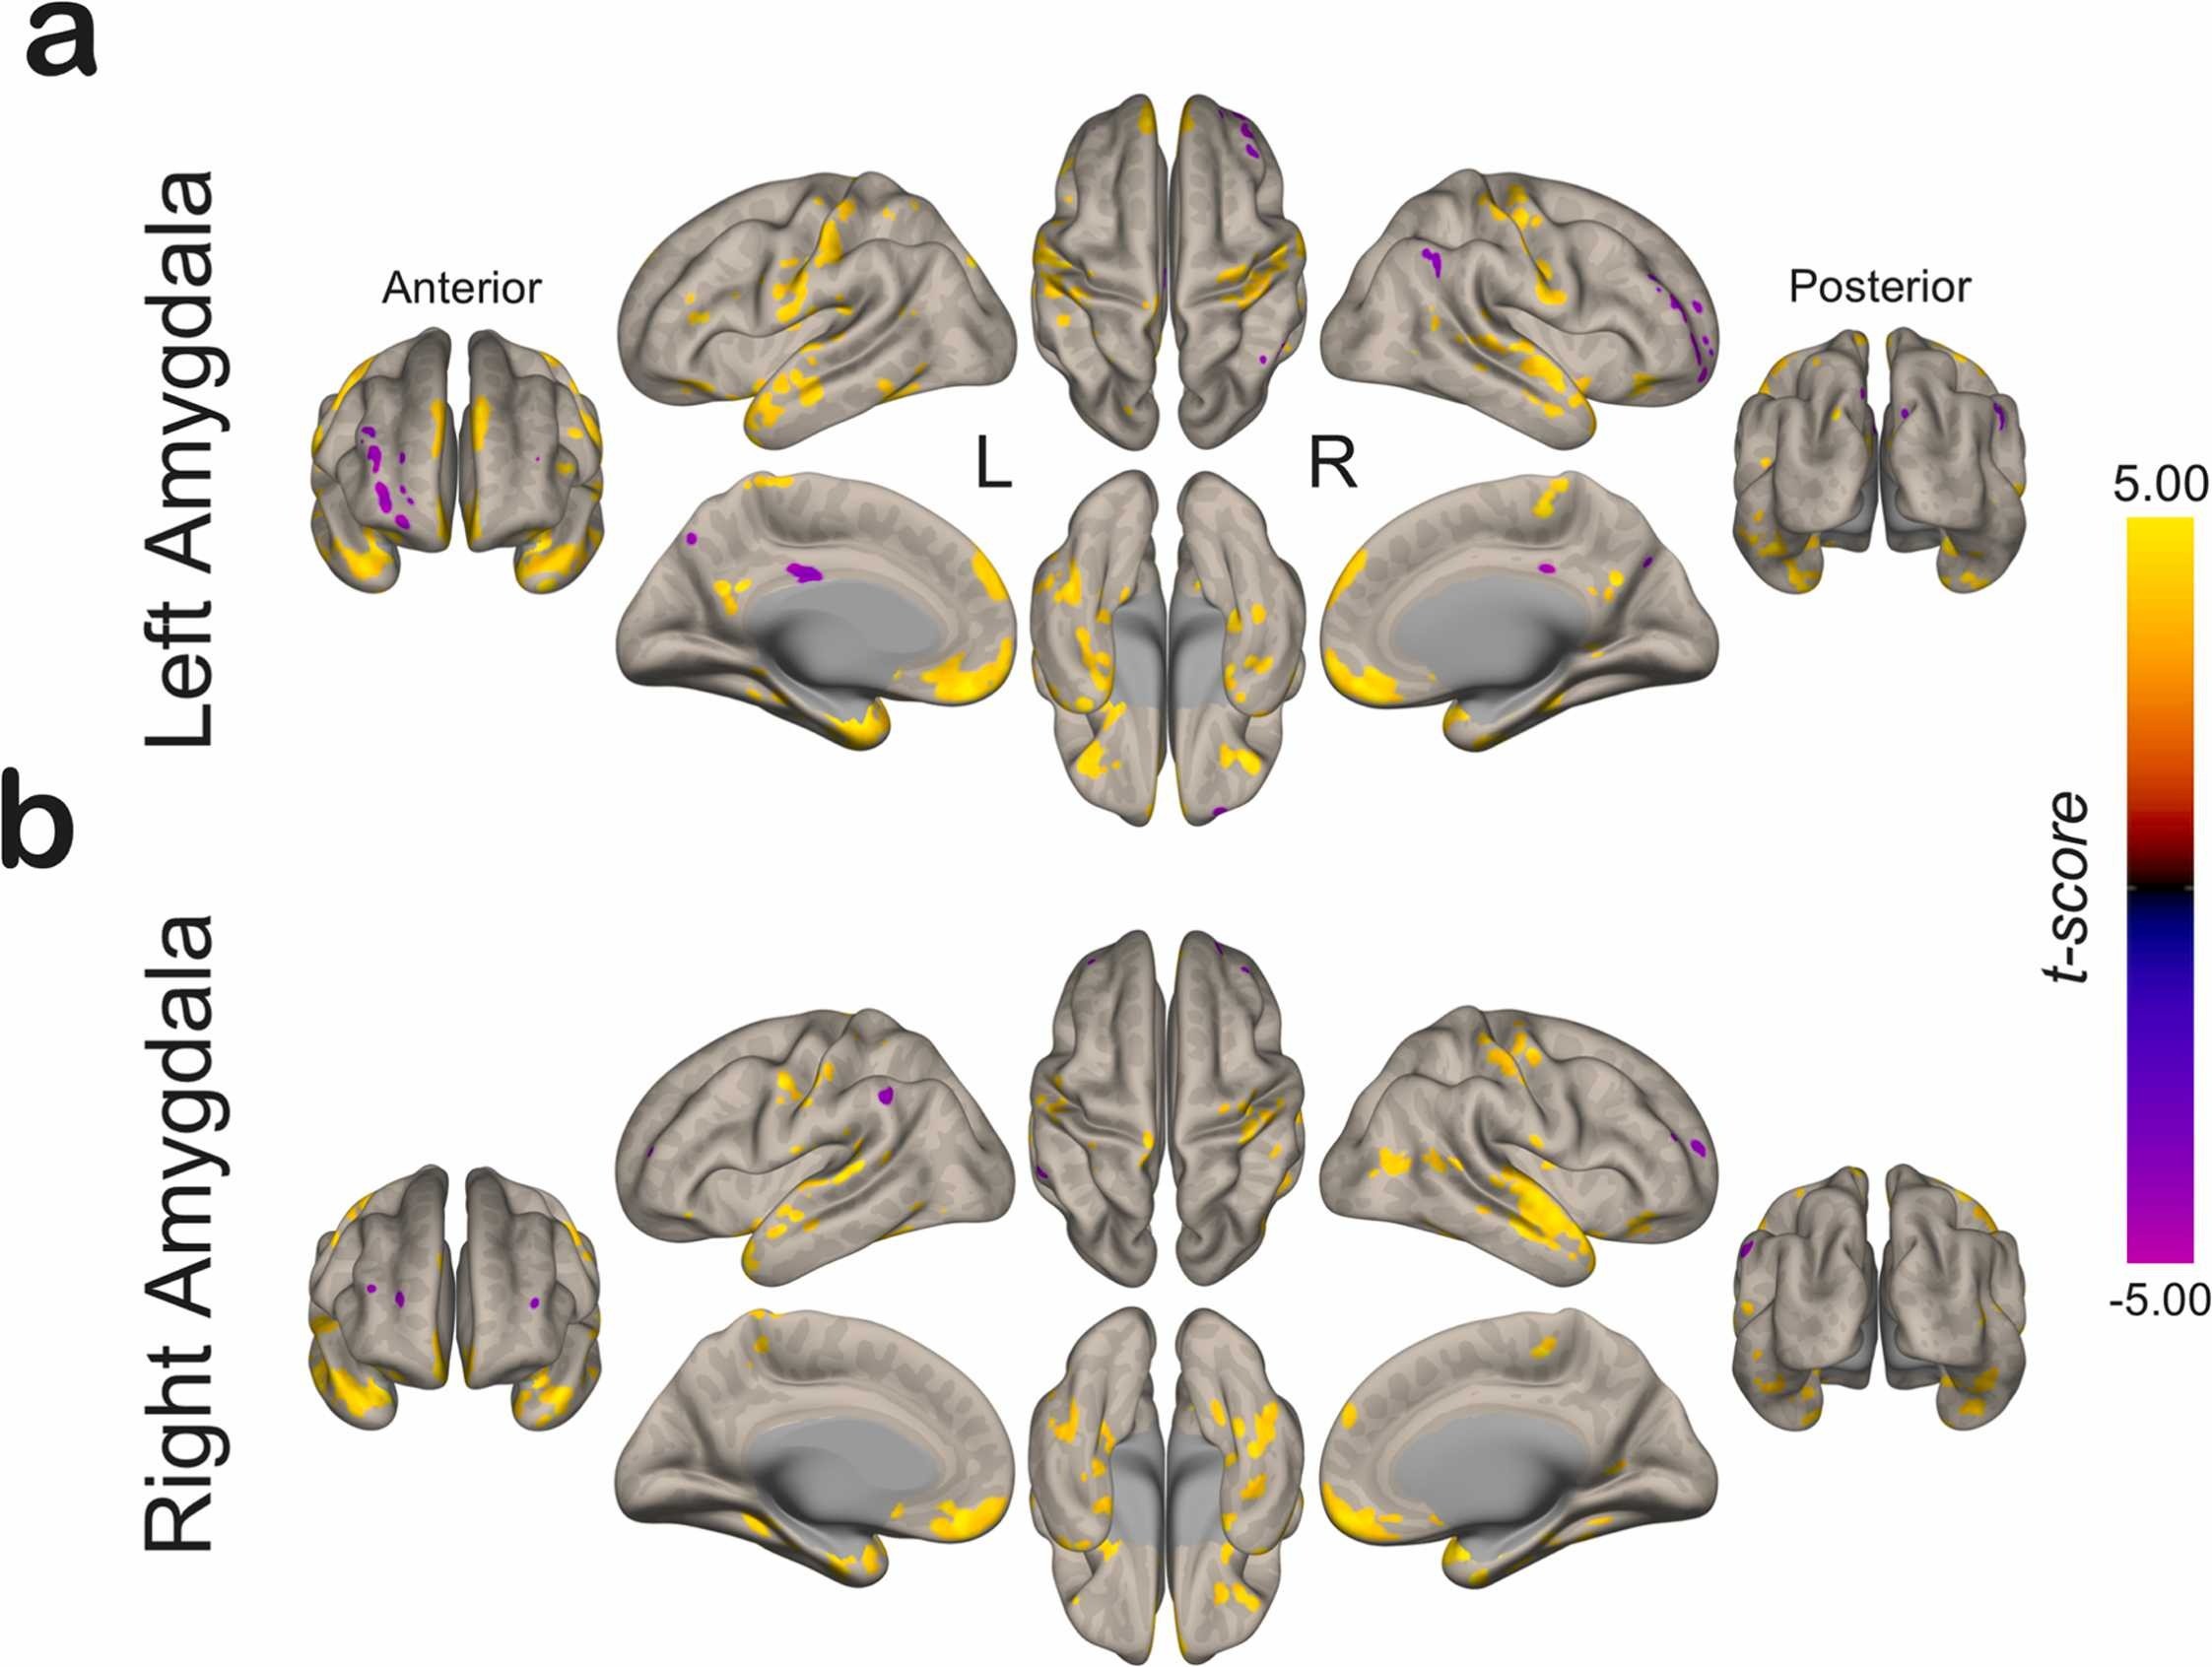
Figure from Serrano et al. 2026 (open access)