Results and discussion
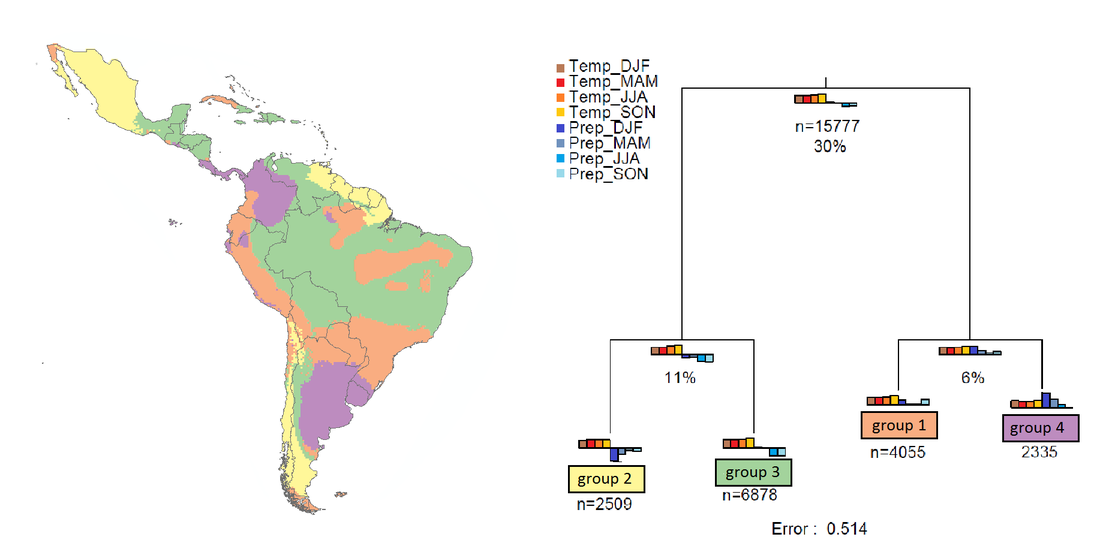
The results of the cluster analysis show with an error of 51.4% that there are four main groups. All these groups experience increments in temperature, and the differences among them are mainly determined by the changes of precipitation during the year. The first split among these groups, and that explained 30% of total variation, was given between those areas that are going to experience decreases of precipitation and those that are going to experience increments. Next, for the areas with decreases of precipitation, a new split that explained 11% of total variation was formed and it was driven mainly by the time in which these decreases of precipitation are going to occur. For the groups with increments of precipitation, a new split that explained 6% of total variation was formed, and it appears to be driven not only by the time in which these increments of precipitation are going to occur, but also for their magnitude.

The comparison of the methods for the modelling of distribution of biomes showed that RF had a better performance with a model error of 10.6 %, while LDA had a model error of 35.7%. The matrix of misclassifications for RF showed that overall, this method had an accuracy above 80% for almost all classes, except for Tropical and Subtropical Dry Broadleaf Forests (71.5%), and Tropical and subtropical moist broadleaf forests (78.2%) (Table 2). On the other hand, the matrix of misclassifications for LDA showed that this method had varying results for the prediction of all classes but really struggled with Tropical and Subtropical Dry Broadleaf Forests (17%) (Table 3). These results agree with the reports from the literature, where Random Forest always shows a greater accuracy than LDA, especially when there is a strong interaction among the predictor variables (Cutler et al., 2007).
Table 2. Matrix of missclassifications for Random Forest.
|
|
Biome |
1 |
2 |
3 |
4 |
5 |
6 |
7 |
8 |
9 |
10 |
11 |
|
1 |
Deserts and Xeric Shrublands |
87.8 |
0.2 |
1.4 |
1.3 |
2 |
0 |
0 |
3.5 |
2.4 |
0.7 |
0.7 |
|
2 |
Flooded Grasslands and Savannas |
0 |
94.7 |
2.2 |
0 |
0 |
0 |
0.7 |
0 |
1.3 |
1 |
0.1 |
|
3 |
Mangroves |
0.6 |
1.5 |
91.9 |
0 |
0 |
0 |
0 |
1.3 |
2.5 |
0.3 |
1.9 |
|
4 |
Mediterranean Forests Woodlands and Scrub |
0.8 |
0 |
0 |
95.5 |
0.8 |
2.8 |
0.1 |
0 |
0 |
0 |
0 |
|
5 |
Montane Grasslands and Shrublands |
0.3 |
0 |
0 |
0.8 |
94 |
0.7 |
1.6 |
0.1 |
1.3 |
0 |
1.2 |
|
6 |
Temperate Broadleaf and Mixed Forests |
0 |
0 |
0 |
4.1 |
0.1 |
94.6 |
1.2 |
0 |
0 |
0 |
0 |
|
7 |
Temperate Grasslands Savannas and Shrublands |
0 |
1 |
0 |
0 |
0.6 |
3.4 |
94.3 |
0 |
0.4 |
0.3 |
0 |
|
8 |
Tropical and Subtropical Coniferous Forests |
1.1 |
0.1 |
3.5 |
0 |
0 |
0 |
0 |
91.7 |
2.7 |
0 |
0.9 |
|
9 |
Tropical and Subtropical Dry Broadleaf Forests |
3.5 |
2.4 |
7.7 |
0 |
1.7 |
0 |
0.7 |
6.8 |
71.5 |
3.1 |
2.6 |
|
10 |
Tropical and Subtropical Grasslands Savannas and Shrublands |
1.5 |
2.4 |
0 |
0 |
0.1 |
0 |
0.1 |
0.1 |
2.1 |
88.8 |
4.9 |
|
11 |
Tropical and Subtropical Moist Broadleaf Forests |
0.5 |
0.5 |
5.2 |
0 |
1.9 |
0 |
0 |
3.3 |
2.4 |
8 |
78.2 |
|
|
Biome |
1 |
2 |
3 |
4 |
5 |
6 |
7 |
8 |
9 |
10 |
11 |
|
1 |
Deserts and Xeric Shrublands |
51.3 |
1.7 |
5.4 |
5.1 |
3.6 |
0 |
0.7 |
8.8 |
21.2 |
0 |
2.2 |
|
2 |
Flooded Grasslands and Savannas |
0.4 |
72.8 |
4.7 |
0 |
0 |
0 |
14.4 |
0 |
0 |
7.1 |
0.6 |
|
3 |
Mangroves |
12.5 |
0 |
55 |
0 |
0 |
0 |
0 |
3.9 |
4.6 |
3.4 |
20.6 |
|
4 |
Mediterranean Forests Woodlands and Scrub |
2.8 |
0 |
0 |
84.2 |
3.6 |
8.2 |
1.2 |
0 |
0 |
0 |
0 |
|
5 |
Montane Grasslands and Shrublands |
0.1 |
0.4 |
0 |
2.2 |
74.4 |
8.9 |
13.3 |
0 |
0.5 |
0.2 |
0 |
|
6 |
Temperate Broadleaf and Mixed Forests |
0 |
0 |
0 |
5.9 |
11.1 |
82.8 |
0.2 |
0 |
0 |
0 |
0 |
|
7 |
Temperate Grasslands Savannas and Shrublands |
0 |
0 |
0 |
0.7 |
11.1 |
2.2 |
86 |
0 |
0 |
0 |
0 |
|
8 |
Tropical and Subtropical Coniferous Forests |
5.8 |
0 |
10.4 |
1.3 |
0.1 |
0.1 |
0 |
82.3 |
0 |
0 |
0 |
|
9 |
Tropical and Subtropical Dry Broadleaf Forests |
9.2 |
30.7 |
18.5 |
0 |
1.8 |
0 |
7 |
10.9 |
17 |
3.8 |
1.1 |
|
10 |
Tropical and Subtropical Grasslands Savannas and Shrublands |
0 |
22.8 |
13.3 |
0.6 |
0 |
0 |
9 |
0 |
0.5 |
51.6 |
2.2 |
|
11 |
Tropical and Subtropical Moist Broadleaf Forests |
1.5 |
4.4 |
17.4 |
0.3 |
1 |
0.6 |
1.1 |
3.1 |
0.9 |
20.6 |
49.1 |

Table 4. Percentages of coverage of area and altitudinal ranges (masl) for each biome for predictions of current climate and for the year 2050. LQ=lower quartile UQ=Upper quartile.
|
Biome |
Curr_Pred (%) |
2050_Pred (%) |
Curr_LQ |
Curr_UQ |
2050_LQ |
2050_UQ |
|
Deserts and Xeric Shrublands |
9.92 |
10.68 |
276 |
1376 |
293 |
1429 |
|
Flooded Grasslands and Savannas |
1.22 |
1.77 |
70 |
131.5 |
112 |
328 |
|
Mangroves |
0.50 |
0.07 |
3 |
15 |
8 |
144 |
|
Mediterranean Forests Woodlands and Scrub |
0.84 |
0.91 |
253.5 |
1385 |
248 |
1279.25 |
|
Montane Grasslands and Shrublands |
4.28 |
3.59 |
3376 |
4327 |
3486 |
4403 |
|
Temperate Broadleaf and Mixed Forests |
1.91 |
1.78 |
174 |
1038.5 |
165 |
990 |
|
Temperate Grasslands Savannas and Shrublands |
7.96 |
7.08 |
97 |
573.75 |
108 |
656 |
|
Tropical and Subtropical Coniferous Forests |
2.68 |
1.54 |
1030 |
2227 |
1595 |
2410 |
|
Tropical and Subtropical Dry Broadleaf Forests |
9.67 |
12.48 |
136 |
526 |
107 |
602.5 |
|
Tropical and Subtropical Grasslands Savannas and Shrublands |
15.70 |
16.63 |
135 |
551 |
162 |
514 |
|
Tropical and Subtropical Moist Broadleaf Forests |
45.30 |
43.46 |
106 |
364 |
99 |
382 |