|
Latitude |
Longitude |
Elevation |
MAT |
MAP |
T_DJF |
T_MAM |
T_JJA |
T_SON |
Prep_DJF |
Prep_MAM |
Prep_JJA |
Prep_SON |
Biome |
|
32.703168 |
-114.898077 |
59 |
22.6 |
62 |
13.5 |
21.4 |
31.8 |
23.7 |
23 |
6 |
15 |
18 |
Deserts_and_Xeric_Shrublands |
|
32.703168 |
-114.812674 |
54 |
22.5 |
66 |
13.4 |
21.3 |
31.8 |
23.6 |
25 |
6 |
16 |
19 |
Deserts_and_Xeric_Shrublands |
|
32.631303 |
-115.568777 |
0 |
22.3 |
119 |
13.7 |
20.5 |
31 |
23.5 |
74 |
35 |
18 |
34 |
Deserts_and_Xeric_Shrublands |
|
32.631303 |
-115.483443 |
2 |
22.4 |
88 |
13.6 |
20.7 |
31.3 |
23.6 |
54 |
21 |
16 |
28 |
Deserts_and_Xeric_Shrublands |
|
32.631303 |
-115.398108 |
8 |
22.6 |
71 |
13.5 |
20.9 |
31.6 |
23.7 |
38 |
11 |
14 |
24 |
Deserts_and_Xeric_Shrublands |
|
32.631303 |
-115.312773 |
10 |
22.7 |
61 |
13.4 |
21.1 |
31.9 |
23.8 |
29 |
7 |
14 |
21 |
Deserts_and_Xeric_Shrublands |
|
32.631303 |
-115.227439 |
18 |
22.8 |
55 |
13.5 |
21.3 |
32.2 |
23.9 |
24 |
6 |
13 |
18 |
Deserts_and_Xeric_Shrublands |
|
32.631303 |
-115.142104 |
23 |
22.8 |
53 |
13.6 |
21.4 |
32.3 |
24 |
21 |
5 |
12 |
17 |
Deserts_and_Xeric_Shrublands |
|
32.631303 |
-115.056769 |
16 |
22.9 |
55 |
13.7 |
21.5 |
32.2 |
23.9 |
20 |
5 |
12 |
16 |
Deserts_and_Xeric_Shrublands |
|
32.631303 |
-114.971435 |
21 |
22.8 |
57 |
13.9 |
21.5 |
32.1 |
24 |
20 |
5 |
13 |
17 |
Deserts_and_Xeric_Shrublands |
|
32.631303 |
-114.8861 |
27 |
22.7 |
62 |
13.8 |
21.5 |
32 |
23.9 |
22 |
5 |
13 |
17 |
Deserts_and_Xeric_Shrublands |
|
32.631303 |
-114.800766 |
32 |
22.6 |
65 |
13.7 |
21.4 |
31.9 |
23.9 |
23 |
6 |
15 |
18 |
Deserts_and_Xeric_Shrublands |
|
32.559437 |
-116.750023 |
180 |
17.6 |
298 |
13.6 |
21.4 |
31.8 |
23.8 |
24 |
6 |
15 |
18 |
Deserts_and_Xeric_Shrublands |
|
32.559437 |
-116.664757 |
550 |
16.2 |
384 |
12.6 |
15.4 |
23.1 |
19.3 |
147 |
88 |
8 |
56 |
Deserts_and_Xeric_Shrublands |
|
32.559437 |
-116.57949 |
568 |
16.1 |
389 |
10.9 |
14 |
22.2 |
17.7 |
189 |
113 |
13 |
68 |
Deserts_and_Xeric_Shrublands |
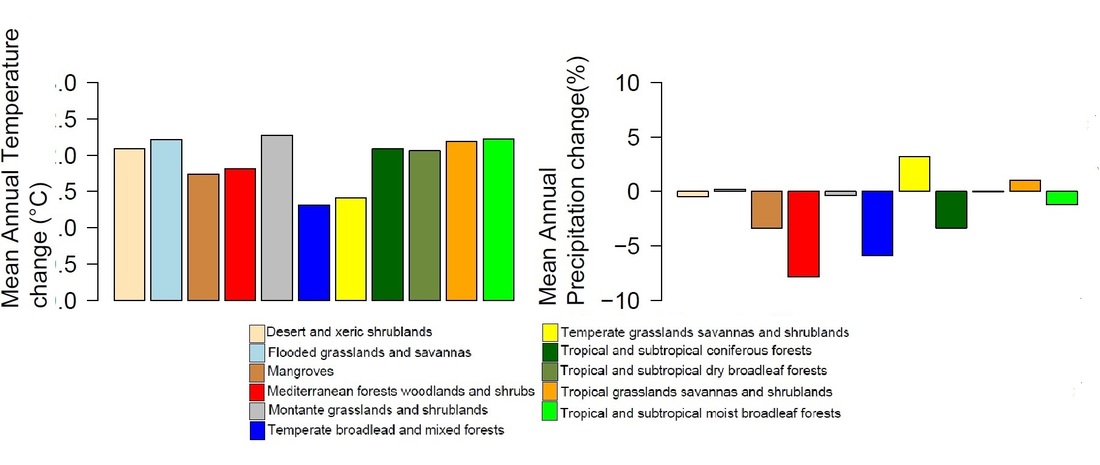
By using the biomes defined by Olson as a reference for analyzing the relationship between the different variables, we can see that the presence of many biomes is dependent on the interaction between many of these variables, such as MAT and MAP.
For example, in figure 3, we see that at low temperatures, the difference between the existence of a biome of the type of Temperate Broadleaf and Mixed Forests or one of the type of Montane Grasslands and Shrublands has to do with levels of precipitation. On the other hand, we see that although Tropical and Subtropical Coniferous Forests and Tropical and Subtropical Dry Broadleaf Forests experience similar levels of precipitation, their presence is dependent on the ranges of temperature, with the Tropical and Subtropical Dry Broadleaf Forests having a higher range of temperature. At high temperatures, we see that the type of biome depends on the levels of precipitation. At high levels of precipitation, we can find Tropical and Subtropical Moist Broadleaf Forests; with lower values of precipitation we can find Tropical Grasslands Savannas and Shrublands, and with the lowest values of precipitation the most likely biome is going to be Deserts and Xeric Shrublands.