Descriptive Statistics
Age and age class distributions and sex ratios of the harvested polar bears are described.
The sea ice, climate and harvest data were summarized and described using simple descriptive statistics and graphs.
Important factors to affecting total harvest and distance travelled are: each community receives a specific quota allocation and the geographic context of each location is very different.
Polar Bear Demographics - Demographic Charts
Polar bear populations are very sensitive to harvesting pressure and will decline if too many females are removed. Females do not reproduce until five or six years of age and then will have cubs every two – three years. Polar bear management regimes encourage a male biased harvest and it is illegal to kill a female with cubs.
The overall sex ratio (female:male) of the harvest is 1:1.56. The sex ratio range over the twenty year period is from 1:1.9 to 1:1. For the majority of years the harvest is weighted toward male polar bears. The sex data is accurate as the hunters must provide evidence of sex to the management authorities.
The age distribution of the harvest appears is standard and weighted toward the younger ages. The median age of harvested bears is 4 years, the mean age 6.5 years and the range from 0 to 30 years.
The age class distribution shows adult (=> 5 years) bears as most commonly harvested with subadults (3 – 4 years) and juveniles (0 - 2 years)following in order. The number of juveniles in the harvest is of some concern as juveniles are very reliant on their mothers, suggesting that that family groups being harvested, contrary to the management approach.
Polar Bear Harvest - Harvest Charts
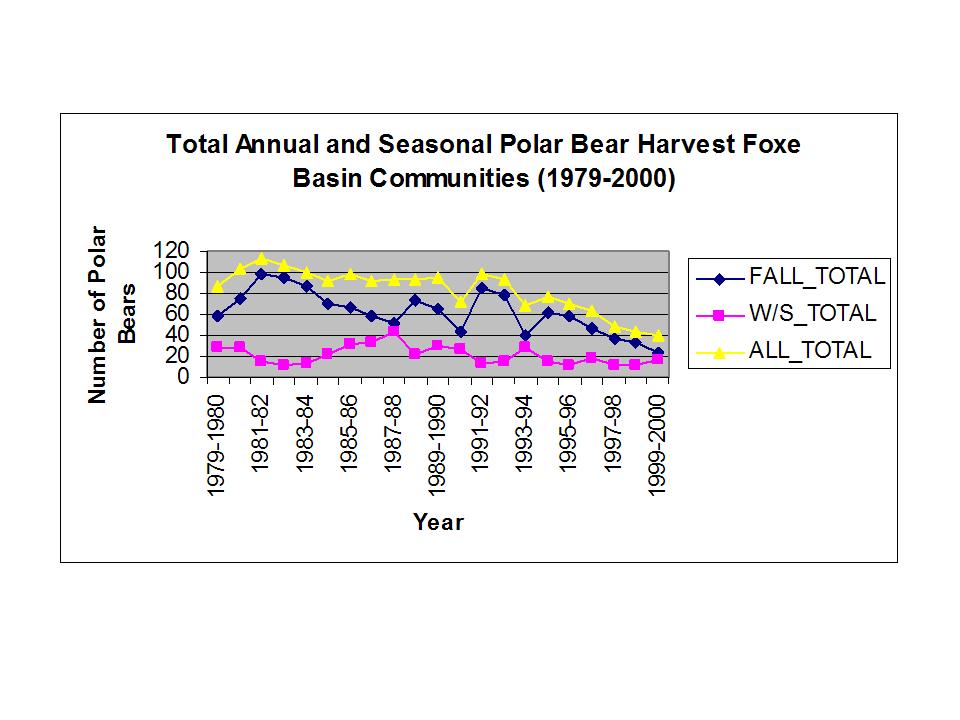
The total annual harvest for Foxe Basin varied between 40 and 114 polar bears and declined in the 1990s. This is in contrast to the total reported harvest for this subpopulation which has remained between 90 and 102 in the late 1990s (Polar Bear Technical Committee 2006). The only way to account for this is that the June-September harvest and/or the harvest of the communities not included in this study are substantial. This result does indicate an important change in hunter activity, particularly Coral Harbour.
Coral Harbour is the most active polar bear hunting community, with Repulse Bay being next and the remaining communities with about equal harvest.
Distance Traveled by Hunters - Distance Charts
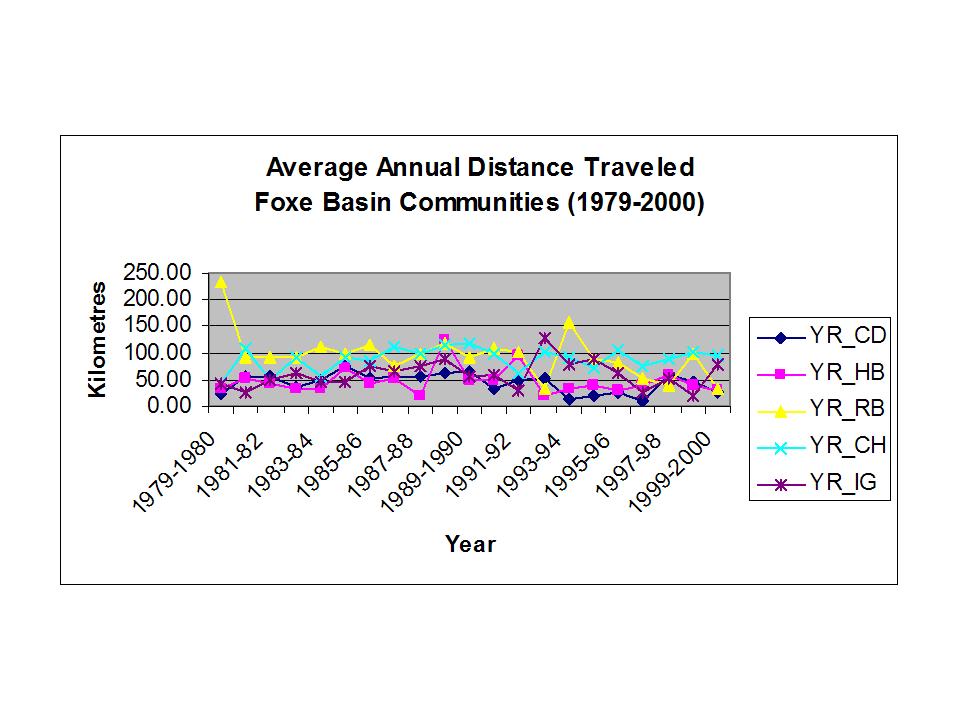
The average annual distance traveled by hunters in Foxe Basin was between 13 and 234 kilometres. There is a large overlap in average distances travelled between communities (Figure 3).
There are no trends apparent in the average seasonal distances traveled for each community. This is surprising as it was expected that the hunters would travel longer distances in the winter/spring season when the ice coverage is close to 100% and travelling conditions are good. It is possible that while the ice coverage is almost complete, the quality of the sea ice is low and not safe for snowmobiling.
There is no information available at this time on distribution of polar bears during the fall and winter/spring seasons. But it appears polar bear distribution does not affect distance travelled. The relatively low level of hunting activity in winter/spring may be because polar bears have moved large distances from the communities on the sea ice and are too far for hunters to easily follow, especially if sea ice quality is variable.
Sea Ice - Sea Ice Charts
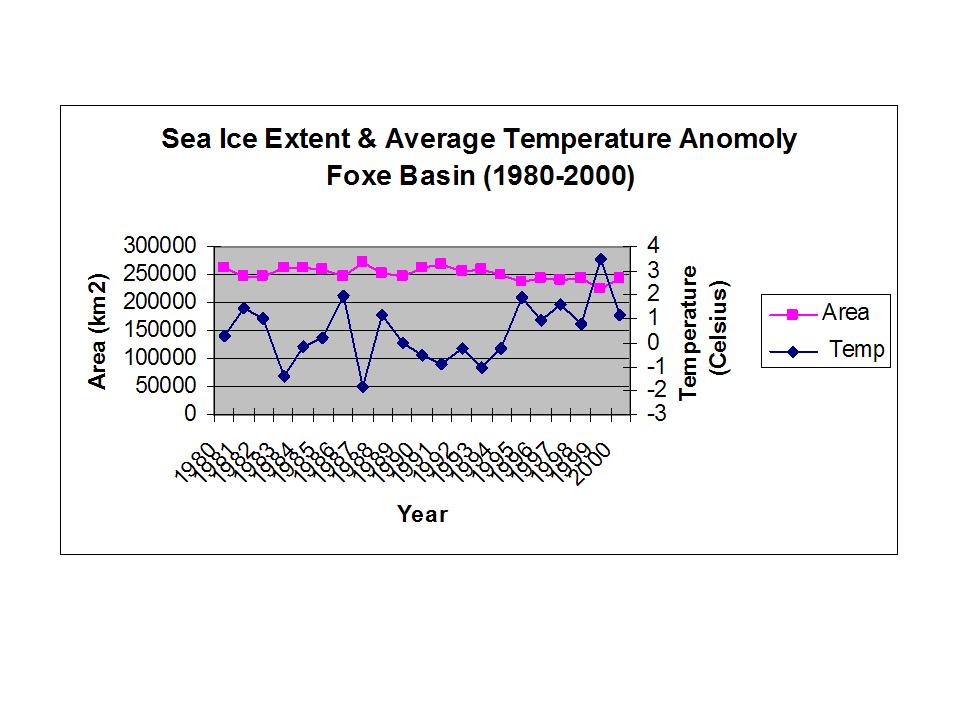
The maximum sea ice extent in Foxe Basin declined during the study period. For all communities there is a negative trend in fall sea ice cover, with Coral Harbour and Cape Dorset being strongest. Only Cape Dorset showed a negative trend in winter sea ice cover.
Sea ice cover was found to be inversely related to temperature, as is to be expected.
Climate - Seasonal Temperature Charts
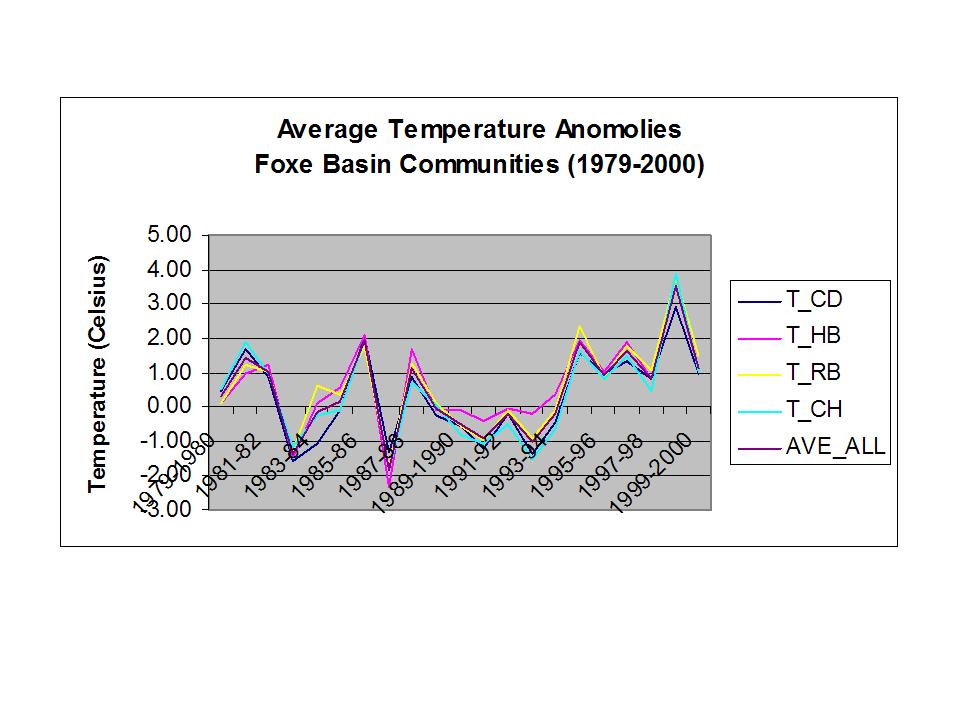
At the regional level and community level a warming (positive) trend was observed in the late 1990s temperature anomaly data. There were some regional differences observed with the most extreme variation at Coral Harbour and the least extreme variation at Cape Dorset.
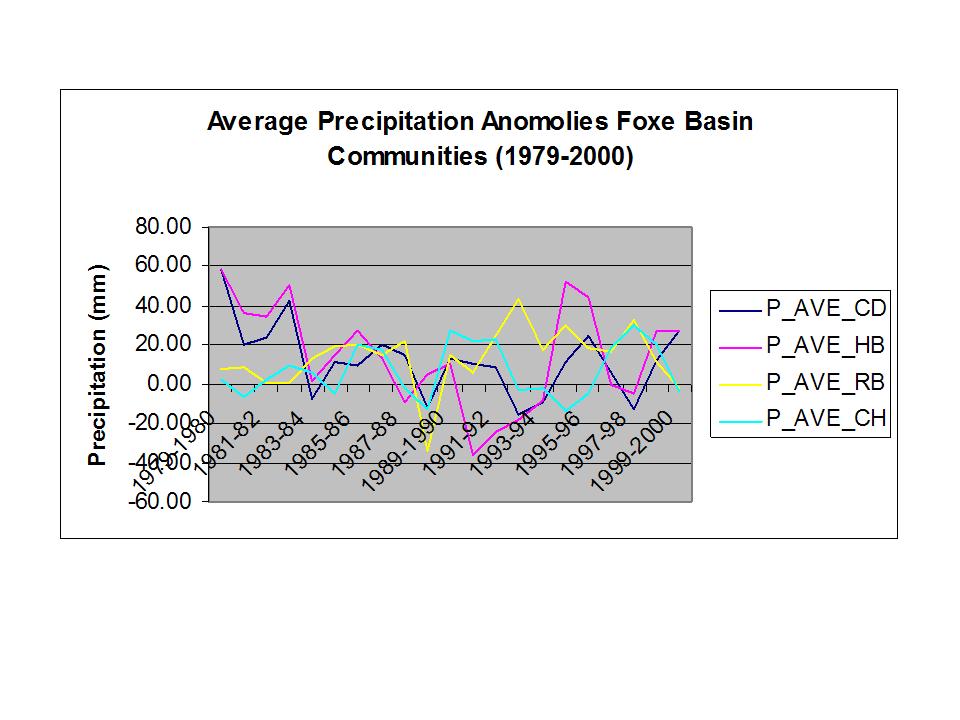
There were no regional or community level trends found in the precipitation anomaly data.
