Canonical Correlation Analysis
Canonical correlation analysis was used to explore relationships between the dependent variables hunter harvest activities (total polar bear harvest/season, average distance travelled by the hunter) and independent environmental variables (average sea ice coverage, average temperature and average precipitation). Each community’s data was explored separately to provide some control for site specific conditions and quota allocations. All variables were compared by season (fall and winter/spring).
Canonical correlation is an accepted means for exploring data sets and for hypothesis testing. It is particularly useful for search for maximal correlations between two sets of variables. The analysis uses linear combinations of two sets of variables (dependent and independent) to assign weightings or coefficients that describe that variable’s correlation in light of others. Canonical correlation analysis creates more than one set of linear combinations and always searches for maximum correlations.
For my purposes I was both exploring for relationships and considering hypotheses. I was searching for combinations hunter activity variables that best correlated with combinations of environmental variables to potentially predict hunter activity from environmental conditions.
Running the Analysis
I used the CANCORR procedure in the SAS statistical software (SAS Institute Inc. 1988) for all canonical correlation analyses.
To check the data set I ran an analysis that should show a strong correlation between variables: sea ice (dependent), temperature and precipitation. The results were good, with a highly significant results for both Igloolik (p=0.0012) and Hall Beach (p=0.0005).
I started each community’s canonical correlation analysis with all variables for both seasons. If results were not significant I continued to run analyses with reduce numbers of dependent and independent variables.
Hypotheses
1. Hunter activity is restricted by sea ice condition and climate.
2. Polar bear vulnerability to harvest is directly related to sea ice condition and climate.
Non-Significant Results
The canonical correlation analyses results for the communities of Igloolik, Hall Beach, and Coral Harbour were non-significant.
Igloolik
The non-significant results for Igloolik were most surprising of all. This community is located on a relatively small island, so it would be expected that sea ice and climate variables would play a significant role in the timing and success of harvesting activities.
The probability values for all Igloolik canonical correlation analyses were strongly non-significant, ranging from p=0.48 to p=0.90.
The graphs of distance travelled and harvest level reflects these results. The fall and winter/spring distances travelled completely overlapped and the seasonal harvests in the 1980s fluctuated a great deal but in the 1990s the fall harvest was usually greater. There were no apparent seasonal trends.
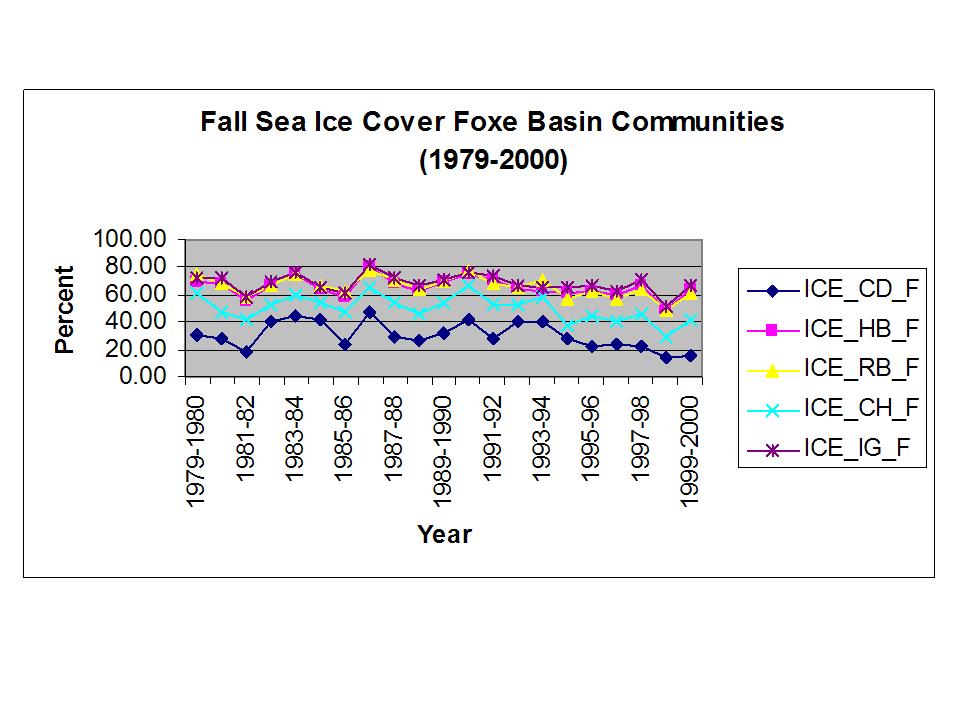
Taking a look at the Igloolik sea ice cover graph the percent cover in the fall is high but not different than Repulse Bay and Hall Beach. I expect that locally the sea ice freezes quickly permitting access to Baffin Island where the bulk of the fall harvest takes place. So the local conditions are not reflected by the average regional (200km buffer) conditions that were used in the analysis.
Hall Beach
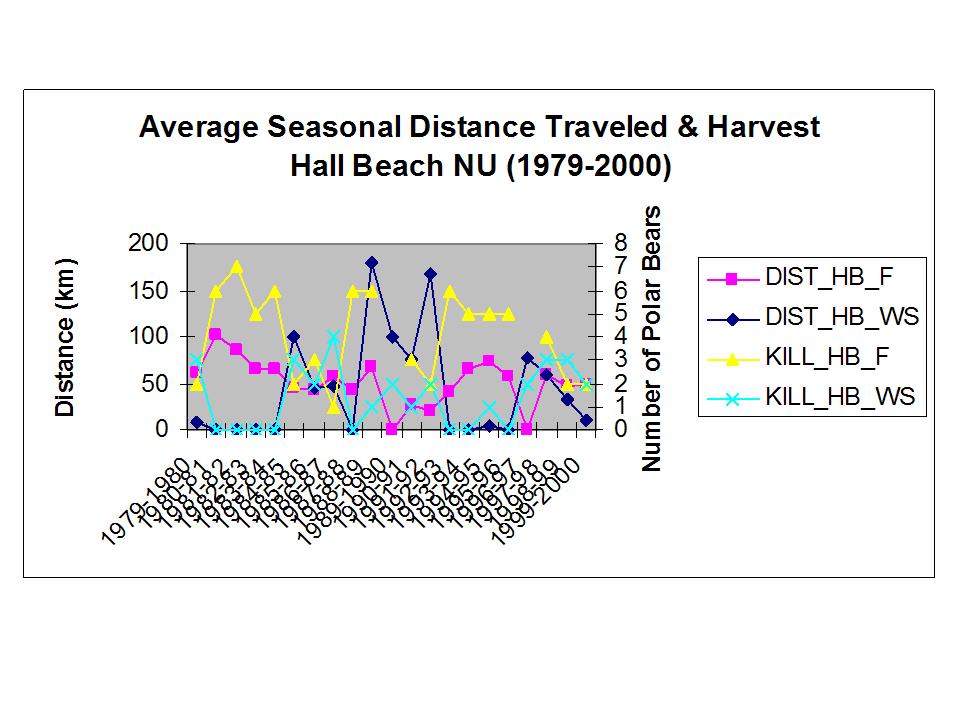
Hall Beach is located approximately 100 kilometres south of Igloolik on the mainland. This community’s ability to travel is not limited by ice but could be by snow conditions.
The probability values for all Hall Beach canonical correlation analyses were strongly non-significant, ranging from p=0.15 to p=0.85.
Again the graphs of distance traveled and harvest level reflects these results. . The fall and winter/spring distances travelled overlapped but there were a few years when winter/spring harvest was zero or very low. The seasonal harvests fluctuated a great deal but the fall harvest was generally greater. There were no apparent seasonal trends.
Coral Harbour
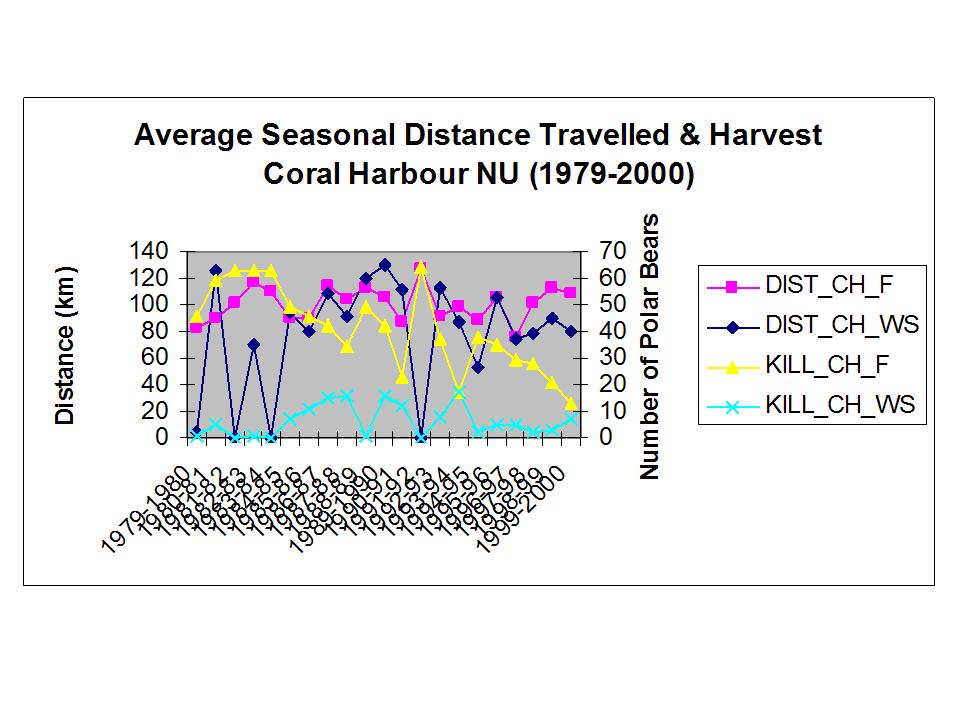
Coral Harbour had the largest level of harvest (n=995) and there were no significant correlations found. The probability values for canonical correlation analyses for the most part were weakly to strongly non-significant, ranging from p=0.10 to p=0.76.
Coral Harbour is located on a very large island in the south of Foxe Basin - Southhampton Island. Travel on the sea ice may be limited in the fall and travel on the land only limited if there is not sufficient snow.
Again the graphs of distance traveled and harvest level reflects these results. Coral Harbour’s polar bear harvest activities are focused in the fall. During this time the ice cover is low in comparison to all other communities except Cape Dorset. The fall and winter/spring distances travelled overlapped and were not different. The graph of the locations of kill sites showed a predominance of hunting activity on the island rather than the sea ice.
Significant Results
Cape Dorset
Only one significant result was found for Cape Dorset: the comparison of fall and winter/spring harvest with fall and winter/spring ice and temperature. The significance level was p=0.01.
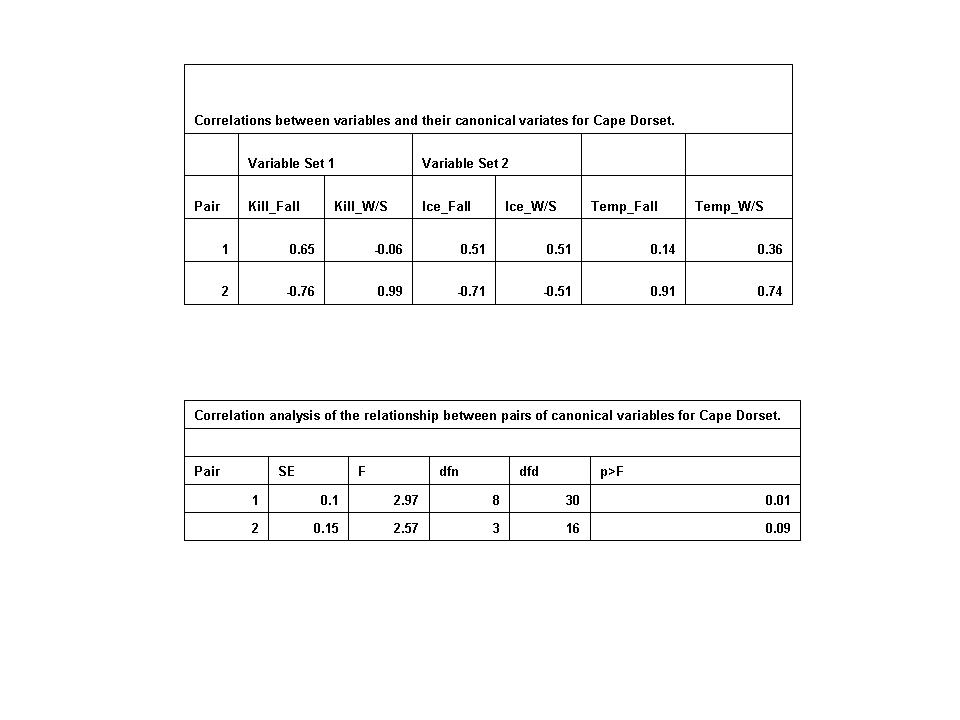
The strongest correlation for the first pair comparison is the relationship of fall harvest (Kill-Fall) with fall sea ice cover (Ice_Fall). This makes intuitive sense as Cape Dorset is on a small island just of the coast of Baffin Island and people would rely upon the ice for travel.
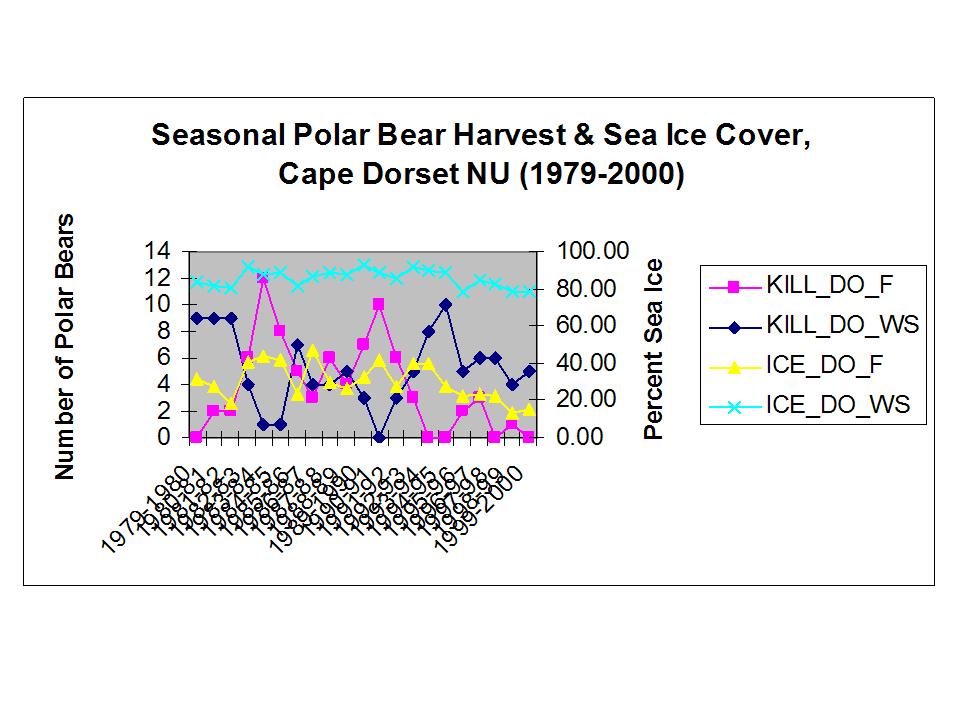
The second pair comparison shows strong negative correlations values for fall harvest and fall sea ice cover and a strong positive value for fall temperature (Temp_Fall). Cape Dorset had the lowest fall ice coverage, 10-20% lower than all other communities. There is some potential that there has been a change in harvest activity as in the 1990s as the fall harvest has concurrently declined with sea ice cover. GRAPH? At the same time there has been little change in the winter sea ice cover. It is difficult to interpret the strong positive winter/spring harvest (Kill_W/S), strong negative winter/spring ice cover (Ice_W/S) and strong positive winter/spring temperature correlation (Temp_W/S).
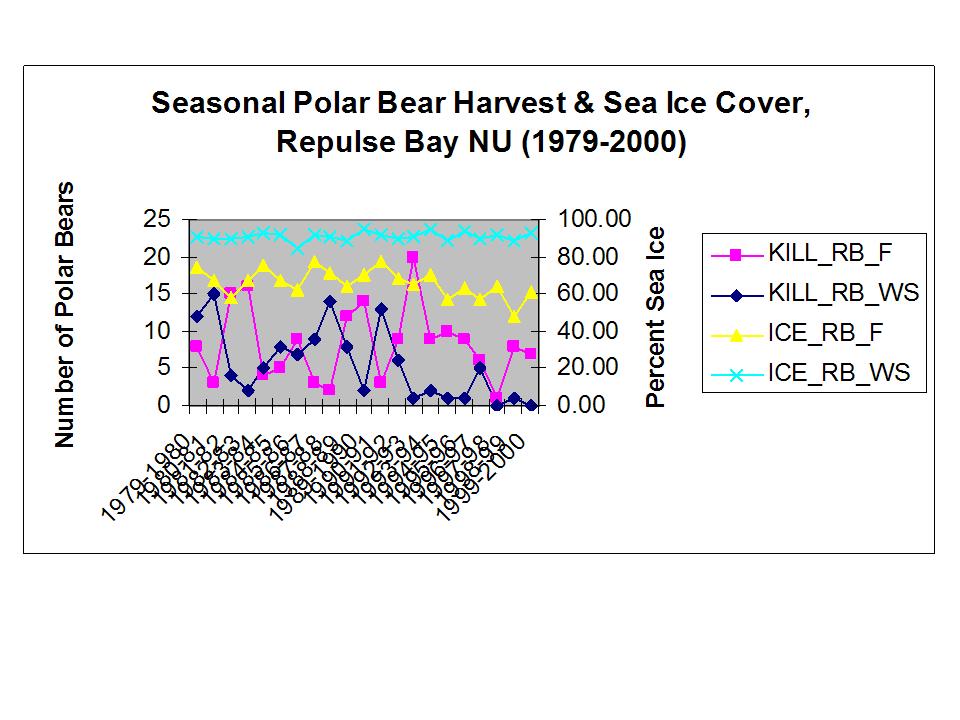
Repulse Bay
The canonical correlation analyses for Repulse Bay provided significant results! At the highest level with all dependent and independent variables included the correlations were weakly significance level at p=0.04. When I removed the harvest variables and ran the analysis the result was not significant. I then replaced harvest and removed the distance variables and the result was strongly significant at p=0.006.
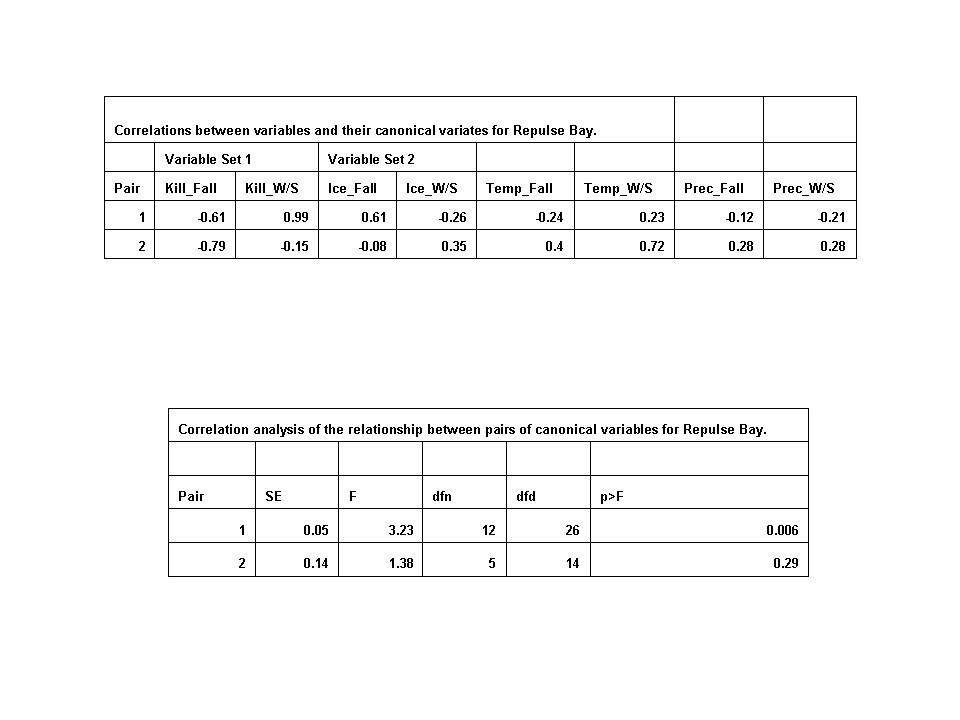
The strongest correlations of the first pair are fall (Kill_Fall) and winter/spring (Kill_W/S) harvest and fall sea ice conditions (Ice_Fall). The fall harvest value is negative and the fall ice value is positive – it is possible that if there is less ice the harvest is greater as the polar bears are forced ashore and are easily accessed by boat or snowmobile. It is difficult to know why the winter harvest value is strongly positive. Perhaps high fall sea ice coverage less to good winter hunting conditions. Graphing harvest with sea ice does not assist interpreting these results. Fall and winter/spring harvest fluctuate a good deal, fall sea ice conditions may be declining slightly and winter sea ice appears stable.
The second pair comparison show a strong negative correlation for fall harvest (Kill_Fall), a positive value for fall (Temp_Fall) and strong positive value for winter/spring (Temp_W/S) temperature. I don’t know how to interpret this result, particularly in light of the low sea ice correlation values.