|
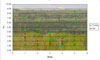
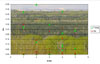
Objective 1: Calculate whether regeneration is spatially clustered or randomly distributed Both mature spruce and seedling locations were found to be spatially clustered. The six data sets which showed the highest degree of clustering were all seedling data. Rocky Mountain House transects showed the least clustering, Whitecourt showed the most clustered patterns. The probability that the observed degree of clustering is due to random chance is also calculated by the SADIE software. 28 of the 50 overall clustering indices (56%) were found to be statistically significant at an alpha level of 0.05. 34, or 68%, of the indices were found to be significant at the slightly less conservative alpha level of 0.1. Each of the transects was mapped so that the raw data and the calculated clustering indices could be easily visualized. Follow the link below to see an example of the results.
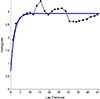
Objective 2: Measure average patch size The average patch size of natural white spruce regeneration across all transects was 17.92 m with a range from 2 m to 48 m. The variogram models calculated for each transect had very low R2 values (<0.2), indicating that the best-fit models calculated still fit the data relatively poorly.
Objective 3: Determine important factors affecting spatial pattern The strength of the seed crop during the year in which the cutblocks were harvested was found to significantly affect the degree of clustering (P=0.0945). The overall clustering index (Ia) of transects in blocks harvested during a mast year was 2.76 which indicates a highly clustered arrangement, compared to Ia=1.60 (moderately clustered) in cutblocks harvested during low seed years. White spruce regeneration (seedlings) were found to be more clustered than mature trees (P=0.1046), with overall clustering indices of 2.54 and 1.81 respectively. The location of the transects in regards to the five study areas had no effect on the degree of clustering (P=0.9998), indicating that the overall spatial clustering patterns were similar throughout the entire study region.
|