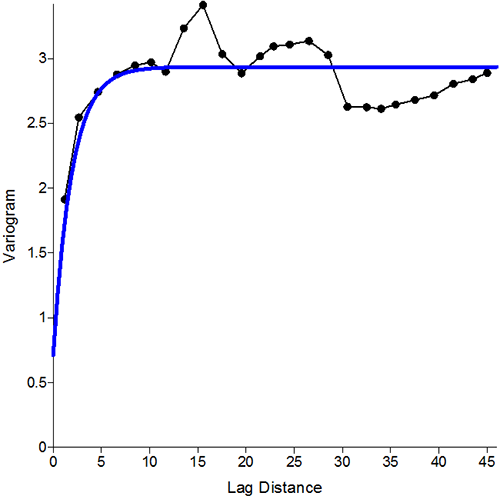
| Example Variogram |
| Variogram showing estimation of patch size: The black dots represent the observed data, and the blue line represents the best-fit exponential curve model. Where the curve levels off, known as the "sill" indicates the radius at which observations are no longer autocorrelated. In this example the sill is at 12 m (24 m patch size) and the R2 of the model was 0.14. |