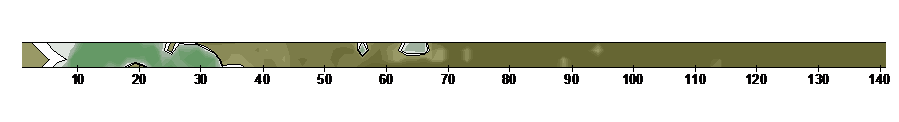
| Example Cluster Mapping Output |
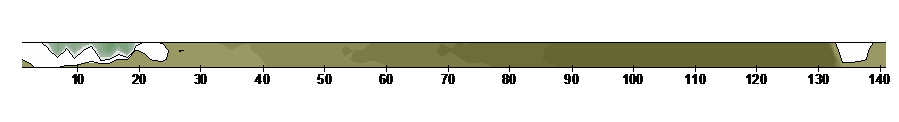
| Density of raw spruce counts: Seedlings (top) Dark green = 4 locations/m2 Mature trees (bottom) Dark green = 0.5 locations/m2 White = 0 locations/m2 |
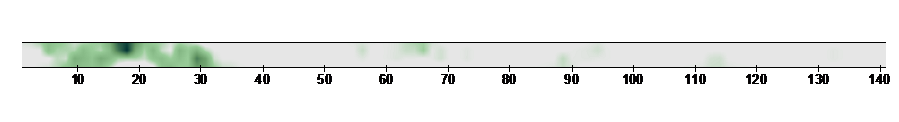
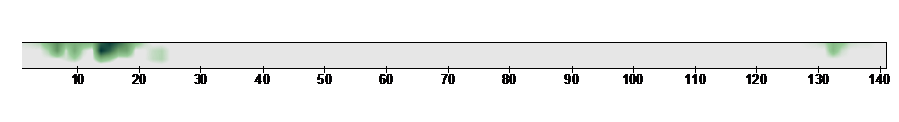
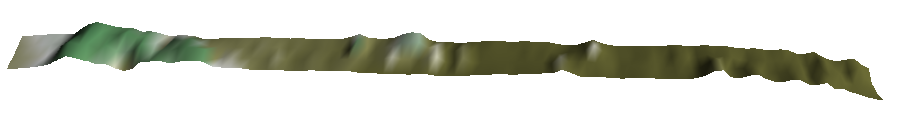
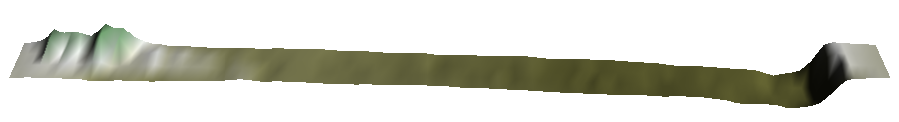
| Clusters: Green shading = patch clusters Brown shading = gap clusters White = density expected from random distribution Darker shading indicates increased cluster strength |
| Clusters visualized in 3D: Green shading = patch clusters Brown shading = gap clusters White = density expected from random distribution Darker shading and increased height indicates increased cluster strength |