

Statistical Methods
The comparison of a
continuous response variable (E.coli concentration) between two
treatments of a categorical independent variable (fenced vs.
unfenced treatment) was completed using a version of the student's
t test. Individual t tests were made for each year: 2004,
2005, 2006, and 2007.
Assumptions
The use of a t test requires that the data, at each treatment level, meets several assumptions. The data needs to be:
- Normally distributed
- Equal variances
- Equal sample size
Prior
to begining analysis, the data were visually examined to confirm that
they met these assumptions. The assumption of equal sample size
was met (n=12 for each treatment, each year). Plotted histograms,
however, presented non-normal distributions for E.coli concentrations
(Figures 9 & 10). Plots of residuals and Bartlett's
test for homogeneity (p=0.6791) also suggested unequal
variances between treatments for each year (Figure 11) .
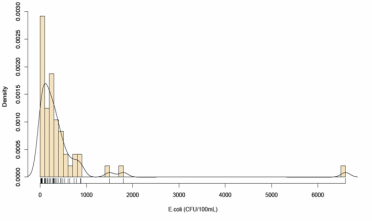
Figure 9. Histogram of E.coli
concentrations from the fenced treatment, with a density estimate line
and rug plot reflecting where the data actually lie along the x axis.
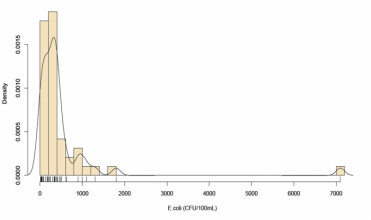
Figure 10. Histogram of E.coli
concentrations from the unfenced/ background treatment, with a density
estimate line and rug plot reflecting where the data actually lie along
the x axis.
Paragraph.
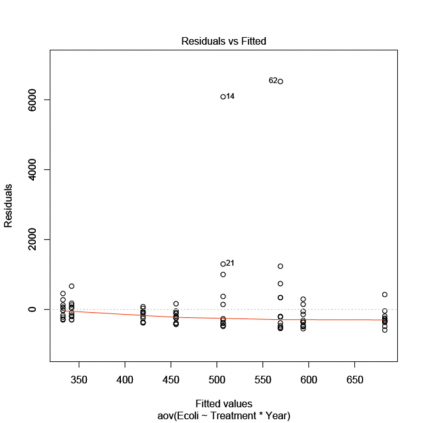
Figure
11. Plot of residuals of E.coli concentrations by treatment and year
Differences in variance are represented by the difference in
vertical spread of the points at each treatment*year.
The presence of outliers creates unequal variances between
treatments in two of the treatment*years. The large limit on
the y axis forces a clustering of data points, but variances appear to
show some difference between treatments, as represented by the red line.
To allow the use of a
parametric statistical test despite the known or potential presence of
unequal variances, I selected a version of the t test, Welch's two
sample t test, that handles inequality in variance by adjusting
degrees of freedom (5). Data distributions were normalized using
a log-10 transformation of E.coli concentrations (Figures 12 &
13). A comparison of pre- and post-transformed data is presented
in the two probability plots below (Figure 14).
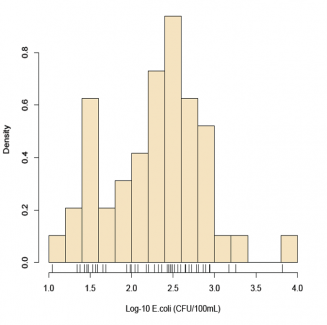
Figure 12. Histogram of log transformed E.coli concentrations from the fenced treatment.
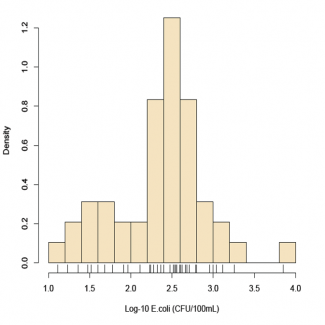
Figure 13. Histogram of the log transformed E.coli concentrations from the unfenced/background treatment.
Paragraph.
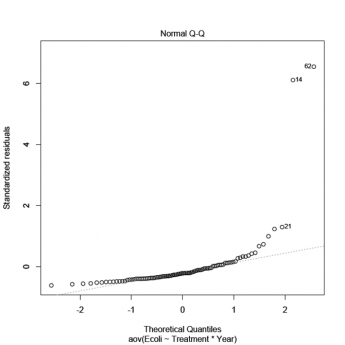
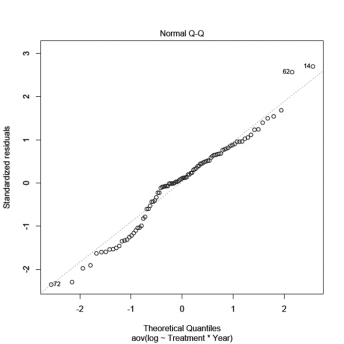
Figure 14. Probability plots
generated for untransformed and log-transformed E.coli concentration
data. With a normal distribution, the plotted points should
lie on a straight line of unit slope from the origin; this is more
closely approached in the log transformed data on the left.
References cited:
(5)
Ruxton, GD. 2006. The unequal variance t test is an underused
alternative to Student's t test and the Mann-Whitney U test.
Behavioural Ecology 47: 688-690.