This chapter focuses on the performance of locally attached disk drives.
If you are not familiar with AIX's concepts of volume groups, logical and physical volumes, and logical and physical partitions, you may want to read "Performance Overview of AIX Management of Fixed-Disk Storage".
Other sections of interest are:
This section contains the following major subsections:
File-system configuration has a large effect on overall system performance and is time-consuming to change after installation. Deciding on the number and types of hard disks, and the sizes and placements of paging spaces and logical volumes on those hard disks, is therefore a critical pre-installation process.
An extensive discussion of the considerations for pre-installation disk configuration planning appears in "Disk Pre-Installation Guidelines".
Before making significant changes in your disk configuration or tuning parameters, it is a good idea to build a baseline of measurements that record the current configuration and performance. In addition to your own measurements, you may want to create a comprehensive baseline with the PerfPMR package. See "Check Before You Change".
Begin the assessment by running iostat with an interval parameter during your system's peak workload period or while running a critical application for which you need to minimize I/O delays. The following shell script runs iostat in the background while a cp of a large file runs in the foreground so that there is some I/O to measure:
$ iostat 5 3 >io.out &
$ cp big1 /dev/null
This would leave the following three reports in io.out:
tty:    tin      tout   cpu:   % user   % sys   % idle   % iowait
        0.0       3.2            0.2      0.6    98.9       0.3

Disks:     % tm_act     Kbps      tps    msps   Kb_read   Kb_wrtn
hdisk0        0.0       0.3       0.0             29753     48076
hdisk1        0.1       0.1       0.0             11971     26460
hdisk2        0.2       0.8       0.1             91200    108355
cd0           0.0       0.0       0.0                 0         0
tty:     tin     tout   cpu:   % user   % sys   % idle   % iowait
         0.0      0.4            0.6      9.7     50.2      39.5

Disks:     % tm_act     Kbps      tps    msps   Kb_read   Kb_wrtn
hdisk0        47.0     674.6      21.8             3376        24
hdisk1         1.2       2.4       0.6                0        12
hdisk2         4.0       7.9       1.8                8        32
cd0            0.0       0.0       0.0                0         0
tty:     tin     tout   cpu:   % user   % sys   % idle   % iowait
         0.6     56.6             0.2    2.0     93.2       4.6

Disks:     % tm_act     Kbps      tps    msps   Kb_read   Kb_wrtn
hdisk0         0.0       0.0       0.0                0         0
hdisk1         0.0       0.0       0.0                0         0
hdisk2         4.8      12.8       3.2               64         0
cd0            0.0       0.0       0.0                0         0
The first, summary, report shows the overall balance (or, in this case, imbalance) in the I/O to each of the hard disks. hdisk1 is almost idle and hdisk2 receives about 63% of the total I/O.
The second report shows the 5-second interval during which cp ran. The data must be viewed with care. The elapsed time for this cp was about 2.6 seconds. Thus, 2.5 seconds of high I/O dependency are being averaged with 2.5 seconds of idle time to yield the 39.5% iowait reported. A shorter interval would have given a more accurate characterization of the command itself, but this example demonstrates the considerations one must take into account in looking at reports that show average activity across intervals.
If the workload shows a significant degree of I/O dependency, you can investigate the physical placement of the files on the disk to determine if reorganization at some level would yield an improvement. To see the placement of the partitions of logical volume hd11 within physical volume hdisk0, use:
$ lslv -p hdisk0 hd11
lslv then reports:
hdisk0:hd11:/home/op
USED  USED  USED  USED  USED  USED  USED  USED  USED  USED     1-10
USED  USED  USED  USED  USED  USED  USED                      11-17
USED  USED  USED  USED  USED  USED  USED  USED  USED  USED    18-27
USED  USED  USED  USED  USED  USED  USED                      28-34
USED  USED  USED  USED  USED  USED  USED  USED  USED  USED    35-44
USED  USED  USED  USED  USED  USED                            45-50
USED  USED  USED  USED  USED  USED  USED  USED  USED  USED    51-60
0052  0053  0054  0055  0056  0057  0058                      61-67
0059  0060  0061  0062  0063  0064  0065  0066  0067  0068    68-77
0069  0070  0071  0072  0073  0074  0075                      78-84
The word USED means that the physical partition is in use by a logical volume other than hd11. The numbers indicate the logical partition of hd11 that is assigned to that physical partition.
We look for the rest of hd11 on hdisk1 with:
$ lslv -p hdisk1 hd11
hdisk1:hd11:/home/op
0035  0036  0037  0038  0039  0040  0041  0042  0043  0044    1-10
0045  0046  0047  0048  0049  0050  0051                     11-17

USED  USED  USED  USED  USED  USED  USED  USED  USED  USED   18-27
USED  USED  USED  USED  USED  USED  USED                     28-34

USED  USED  USED  USED  USED  USED  USED  USED  USED  USED   35-44
USED  USED  USED  USED  USED  USED                           45-50

0001  0002  0003  0004  0005  0006  0007  0008  0009  0010   51-60
0011  0012  0013  0014  0015  0016  0017                     61-67

0018  0019  0020  0021  0022  0023  0024  0025  0026  0027   68-77
0028  0029  0030  0031  0032  0033  0034                     78-84
We see that logical volume hd11 is fragmented within physical volume hdisk1, with its first logical partitions in the inner-middle and inner regions of hdisk1, while logical partitions 35-51 are in the outer region. A workload that accessed hd11 randomly would experience unnecessary I/O wait time as the disk's accessor moved back and forth between the parts of hd11. These reports also show us that there are no free physical partitions in either hdisk0 or hdisk1.
If we look at hd2 (the logical volume containing the /usr file system) on hdisk2 with:
$ lslv -p hdisk2 hd2
we find some physical partitions that are FREE:
hdisk2:hd2:/usr
USED  USED  USED  USED  FREE  FREE  FREE  FREE  FREE  FREE     1-10
FREE  FREE  FREE  FREE  FREE  FREE  FREE  FREE  FREE  FREE    11-20
FREE  FREE  FREE  FREE  FREE  FREE  FREE  FREE  FREE  FREE    21-30
FREE  FREE  FREE  FREE  FREE  FREE  FREE  FREE  FREE  FREE    31-40
FREE                                                          41-41

USED  USED  USED  USED  USED  USED  USED  USED  USED  USED    42-51
USED  USED  USED  USED  USED  USED  FREE  FREE  FREE  FREE    52-61
FREE  FREE  FREE  FREE  FREE  FREE  FREE  FREE  FREE  FREE    62-71
FREE  FREE  FREE  FREE  FREE  FREE  FREE  FREE  FREE  FREE    72-81
FREE                                                          82-82

USED  USED  0001  0002  0003  0004  0005  0006  0007  0008    83-92
0009  0010  0011  0012  0013  0014  0015  USED  USED  USED   93-102
USED  0016  0017  0018  0019  0020  0021  0022  0023  0024  103-112
0025  0026  0027  0028  0029  0030  0031  0032  0033  0034  113-122

0035  0036  0037  0038  0039  0040  0041  0042  0043  0044  123-132
0045  0046  0047  0048  0049  0050  0051  0052  0053  0054  133-142
0055  0056  0057  0058  0059  0060  0061  0062  0063  0064  143-152
0065  0066  0067  0068  0069  0070  0071  0072  0073  0074  153-162
0075                                                        163-163

0076  0077  0078  0079  0080  0081  0082  0083  0084  0085  164-173
0086  0087  0088  0089  0090  0091  0092  0093  0094  0095  174-183
0096  0097  0098  0099  0100  FREE  FREE  FREE  FREE  FREE  184-193
FREE  FREE  FREE  FREE  FREE  FREE  FREE  FREE  FREE  FREE  194-203
FREE                                                        204-204
There are several interesting differences from the previous reports. The hd2 logical volume is contiguous, except for four physical partitions (100-103). Other lslvs (not shown) tell us that these partitions are used for hd1, hd3, and hd9var (/home, /tmp, and /var, respectively).
If we want to see how the file copied earlier, big1, is stored on the disk, we can use the fileplace command:
$ fileplace -pv big1
File: big1  Size: 3554273 bytes  Vol: /dev/hd10 (4096 byte blks)
Inode: 19  Mode: -rwxr-xr-x  Owner: frankw  Group: system

Physical blocks (mirror copy 1)                    Logical blocks
-------------------------------                   --------------
01584-01591  hdisk0       8 blks,    32 KB,   0.9%    01040-01047
01624-01671  hdisk0      48 blks,   192 KB,   5.5%    01080-01127
01728-02539  hdisk0     812 blks,  3248 KB,  93.5%    01184-01995

  868 blocks over space of 956:  space efficiency = 90.8%
  3 fragments out of 868 possible:  sequentiality = 99.8%
This shows that there is very little fragmentation within the file, and those are small gaps. We can therefore infer that the disk arrangement of big1 is not affecting its sequential read time significantly. Further, given that a (recently created) 3.5MB file encounters this little fragmentation, it appears that the file system in general has not become particularly fragmented.
Note: If a file has been created by seeking to various locations and writing widely dispersed records, only the pages that contain records will take up space on disk and appear on a fileplace report. The file system does not fill in the intervening pages automatically when the file is created. However, if such a file is read sequentially, by the cp or tar commands, for example, the space between records is read as binary zeroes. Thus, the output of such a cp command can be much larger than the input file, although the data is the same.
In AIX Version 4, the fileplace command is packaged as part of the Performance Toolbox for AIX. To determine whether fileplace is available, use:
lslpp -lI perfagent.tools
If this package has been installed, fileplace is available.
If we found that a volume was sufficiently fragmented to require reorganization, we could use smit to run the reorgvg command (smit -> Physical & Logical Storage -> Logical Volume Manager -> Volume Groups -> Set Characteristics of a Volume Group -> Reorganize a Volume Group). The fast path is:
# smit reorgvg
Use of this command against rootvg on the test system, with no particular logical volumes specified, resulted in migration of all of the logical volumes on hdisk2. After the reorganization, the output of an
$ lslv -p hdisk2 hd2
hdisk2:hd2:/usr
USED  USED  USED  USED  USED  USED  USED  USED  FREE  FREE      1-10
FREE  FREE  FREE  FREE  FREE  FREE  FREE  FREE  FREE  FREE     11-20
FREE  FREE  FREE  FREE  FREE  FREE  FREE  FREE  FREE  FREE     21-30
FREE  FREE  FREE  FREE  FREE  FREE  FREE  FREE  FREE  FREE     31-40
FREE                                                           41-41

USED  USED  USED  USED  USED  USED  USED  USED  USED  USED     42-51
USED  USED  USED  USED  USED  USED  FREE  FREE  FREE  FREE     52-61
FREE  FREE  FREE  FREE  FREE  FREE  FREE  FREE  FREE  FREE     62-71
FREE  FREE  FREE  FREE  FREE  FREE  FREE  FREE  FREE  FREE     72-81
FREE                                                           82-82

USED  USED  0001  0002  0003  0004  0005  0006  0007  0008     83-92
0009  0010  0011  0012  0013  0014  0015  0016  0017  0018    93-102
0019  0020  0021  0022  0023  0024  0025  0026  0027  0028   103-112
0029  0030  0031  0032  0033  0034  0035  0036  0037  0038   113-122

0039  0040  0041  0042  0043  0044  0045  0046  0047  0048   123-132
0049  0050  0051  0052  0053  0054  0055  0056  0057  0058   133-142
0059  0060  0061  0062  0063  0064  0065  0066  0067  0068   143-152
0069  0070  0071  0072  0073  0074  0075  0076  0077  0078   153-162
0079                                                         163-163

0080  0081  0082  0083  0084  0085  0086  0087  0088  0089   164-173
0090  0091  0092  0093  0094  0095  0096  0097  0098  0099   174-183
0100  FREE  FREE  FREE  FREE  FREE  FREE  FREE  FREE  FREE   184-193
FREE  FREE  FREE  FREE  FREE  FREE  FREE  FREE  FREE  FREE   194-203
FREE                                                         204-204
The physical-partition fragmentation within hd2 that was seen in the previous report has disappeared. However, we have not affected any fragmentation at the physical-block level that may exist within the /usr file system. Since most of the files in /usr are written once, during system installation, and are not updated thereafter, /usr is unlikely to experience much internal fragmentation. User data in the /home file system is another matter.
The test system has a separate logical volume and file system hd11 (mount point: /home/op) for potentially destructive testing. If we decide that hd11 needs to be reorganized, we start by backing up the data with:
# cd /home/op
# find . -print | pax -wf/home/waters/test_bucket/backuptestfile
which creates a backup file (in a different file system) containing all of the files in the file system to be reorganized. If the disk space on the system is limited, this backup could be done to tape.
Before the file system can be rebuilt, you must run unmount, as follows:
# unmount /home/op
If any processes are using /home/op or any of its subdirectories, they must be killed before the unmount can succeed.
To remake the file system on/home/op's logical volume, enter:
# mkfs /dev/hd11
You are prompted for confirmation before the old file system is destroyed. The name of the file system does not change. To restore the original situation (except that /home/op is empty), enter:
# mount /dev/hd11 /home/op
# cd /home/op
# pax -rf/home/frankw/tuning.io/backuptestfile >/dev/null
Standard out is redirected to /dev/null to avoid displaying the name of each of the files restored, which can be very time-consuming.
If we look again at the large file inspected earlier, with:
# fileplace -piv big1
we see that it is now (nearly) contiguous:
File: big1  Size: 3554273 bytes  Vol: /dev/hd11 (4096 byte blks)
Inode: 8290  Mode: -rwxr-xr-x  Owner: frankw  Group: system

INDIRECT BLOCK: 60307

Physical blocks (mirror copy 1)                   Logical blocks
-------------------------------                   --------------
60299-60306  hdisk1     8 blks,    32 KB,   0.9%    08555-08562
60308-61167  hdisk1   860 blks,  3440 KB,  99.1%    08564-09423

  868 blocks over space of 869:  space efficiency = 99.9%
  2 fragments out of 868 possible:  sequentiality = 99.9%
The -i option that we added to the fileplace command shows us that the one-block gap between the first eight blocks of the file and the remainder contains the indirect block, which is required to supplement the i-node information when the length of the file exceeds eight blocks.
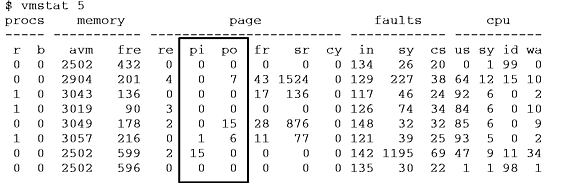
I/O to and from paging spaces is random, mostly one page at a time. vmstat reports indicate the amount of paging-space I/O taking place. Both of the following examples show the paging activity that occurs during a C compilation in a machine that has been artificially shrunk using rmss. The pi and po (paging-space page ins and paging-space page outs) columns show the amount of paging-space I/O (in terms of 4096-byte pages) during each 5-second interval. The first, summary, report has been removed. Notice that the paging activity occurs in bursts.
The following before and after vmstat -s reports show the accumulation of paging activity. Remember that it is the "paging space page ins" and ". . .outs" that represent true paging-space I/O. The (unqualified) "page ins" and "page outs" report total I/O--both paging-space I/O and the ordinary file I/O that is also performed by the paging mechanism. (The reports have been edited to remove lines that are irrelevant to this discussion.)
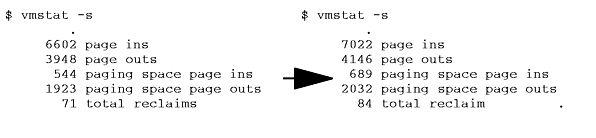
The fact that more paging-space page ins than page outs occurred during the compilation suggests that we had shrunk the system to the point of incipient thrashing. Some pages were being repaged because their frames were stolen before their use was complete (that is, before any change had been made).
The technique just discussed can also be used to assess the disk I/O load generated by a program. If the system is otherwise idle, the sequence:
$ vmstat -s >statout
$ testpgm
$ sync
$ vmstat -s >> statout
$ egrep "ins|outs" statout
will yield a before and after picture of the cumulative disk activity counts, such as:
     5698 page ins
     5012 page outs
        0 paging space page ins
       32 paging space page outs
     6671 page ins
     5268 page outs
        8 paging space page ins
      225 paging space page outs
During the period when this command (a large C compile) was running, the system read a total of 981 pages (8 from paging space) and wrote a total of 449 pages (193 to paging space).
The filemon command uses the trace facility to obtain a detailed picture of I/O activity during a time interval. Since it uses the trace facility, filemon can be run only by root or by a member of the system group.
In AIX Version 4, the filemon command is packaged as part of the Performance Toolbox for AIX. To determine whether filemon is available, use:
lslpp -lI perfagent.tools
If this package has been installed, filemon is available.
Tracing is started by the filemon command, optionally suspended with trcoff and resumed with trcon, and terminated with trcstop. As soon as tracing is terminated, filemon writes its report to stdout. The following sequence of commands gives a simple example of filemon use:
# filemon -o fm.test.out ; cp smit.log /dev/null ; trcstop
The report produced by this sequence, in an otherwise-idle system, was:
Wed Jan 12 11:28:25 1994
System: AIX alborz Node: 3 Machine: 000249573100

0.303 secs in measured interval
Cpu utilization:  55.3%

Most Active Segments
------------------------------------------------------------------------
  #MBs  #rpgs  #wpgs  segid  segtype              volume:inode
------------------------------------------------------------------------
   0.1     26      0   0984  persistent           /dev/hd1:25
   0.0      1      0   34ba  .indirect            /dev/hd1:4

Most Active Logical Volumes
------------------------------------------------------------------------
  util  #rblk  #wblk   KB/s  volume               description
------------------------------------------------------------------------
  0.66    216      0  357.0  /dev/hd1             /home

Most Active Physical Volumes
------------------------------------------------------------------------
  util  #rblk  #wblk   KB/s  volume               description
------------------------------------------------------------------------
  0.65    216      0  357.0  /dev/hdisk1          320  MB SCSI

------------------------------------------------------------------------
Detailed VM Segment Stats   (4096 byte pages)
------------------------------------------------------------------------

SEGMENT: 0984  segtype: persistent  volume: /dev/hd1  inode: 25
segment flags:          pers
reads:                  26      (0 errs)
  read times (msec):    avg  45.644 min   9.115 max 101.388 sdev  33.045
  read sequences:       3
  read seq. lengths:    avg     8.7 min       1 max      22 sdev     9.5
SEGMENT: 34ba  segtype: .indirect  volume: /dev/hd1  inode: 4
segment flags:          pers jnld sys
reads:                  1       (0 errs)
  read times (msec):    avg  16.375 min  16.375 max  16.375 sdev   0.000
  read sequences:       1
  read seq. lengths:    avg     1.0 min       1 max       1 sdev     0.0

------------------------------------------------------------------------
Detailed Logical Volume Stats   (512 byte blocks)
------------------------------------------------------------------------

VOLUME: /dev/hd1  description: /home
reads:                  27      (0 errs)
  read sizes (blks):    avg     8.0 min       8 max       8 sdev     0.0
  read times (msec):    avg  44.316 min   8.907 max 101.112 sdev  32.893
  read sequences:       12
  read seq. lengths:    avg    18.0 min       8 max      64 sdev    15.4
seeks:                  12      (44.4%)
  seek dist (blks):     init    512
                        avg   312.0 min       8 max    1760 sdev   494.9
time to next req(msec): avg   8.085 min   0.012 max  64.877 sdev  17.383
throughput:             357.0 KB/sec
utilization:            0.66
------------------------------------------------------------------------
Detailed Physical Volume Stats   (512 byte blocks)
------------------------------------------------------------------------

VOLUME: /dev/hdisk1  description: 320  MB SCSI
reads:                  14      (0 errs)
  read sizes (blks):    avg    15.4 min       8 max      32 sdev     8.3
  read times (msec):    avg  13.989 min   5.667 max  25.369 sdev   5.608
  read sequences:       12
  read seq. lengths:    avg    18.0 min       8 max      64 sdev    15.4
seeks:                  12      (85.7%)
  seek dist (blks):     init 263168,
                        avg   312.0 min       8 max    1760 sdev   494.9
  seek dist (cyls):     init    399
                        avg     0.5 min       0 max       2 sdev     0.8
time to next req(msec): avg  27.302 min   3.313 max  64.856 sdev  22.295
throughput:             357.0 KB/sec
utilization:            0.65
The Most Active Segments report lists the most active files. To identify unknown files, you could translate the logical volume name, /dev/hd1, to the mount point of the file system, /home, and use the find command:
# find /home -inum 25 -print
/home/waters/smit.log
Using filemon in systems with real workloads would result in much larger reports and might require more trace buffer space. filemon's space and CPU time consumption can degrade system performance to some extent. You should experiment with filemon on a nonproduction system before starting it in a production environment.
Note: Although filemon reports average, minimum, maximum, and standard deviation in its detailed-statistics sections, the results should not be used to develop confidence intervals or other formal statistical inferences. In general, the distribution of data points is neither random nor symmetrical.
Disk sensitivity can come in a number of forms, with different resolutions:
Information on the appropriate ratio of disk drives to disk adapters is given in the following section.
Unfortunately, every performance-tuning effort ultimately does reach a point of diminishing returns. The question then becomes, "What hardware do I need, how much of it, and how do I make the best use of it?" That question is especially tricky with disk-limited workloads because of the large number of variables. Changes that might improve the performance of a disk-limited workload include:
Precisely because this question is complex and highly dependent on the workload and configuration, and because the absolute and relative speeds of disks, adapters, and processors are changing so rapidly, this guide can't give a prescription, only some "rules of thumb."
For more guidance more closely focused on your configuration and workload, you could use a measurement-driven simulator, such as BEST/1.
The backup, fileplace, lslv, lsps, lspv, reorgvg, smit, and unmount commands
"Performance Overview of the Virtual Memory Manager (VMM)"
"Placement and Sizes of Paging Spaces"