Magnetotelluric signals from a Lightning Stroke

These data were collected in Central California. Lightening activity in the tropics generates spherics such as this. Thunderstorm activity too close to the measurement site, gives distorted data and the the risk of being struck.
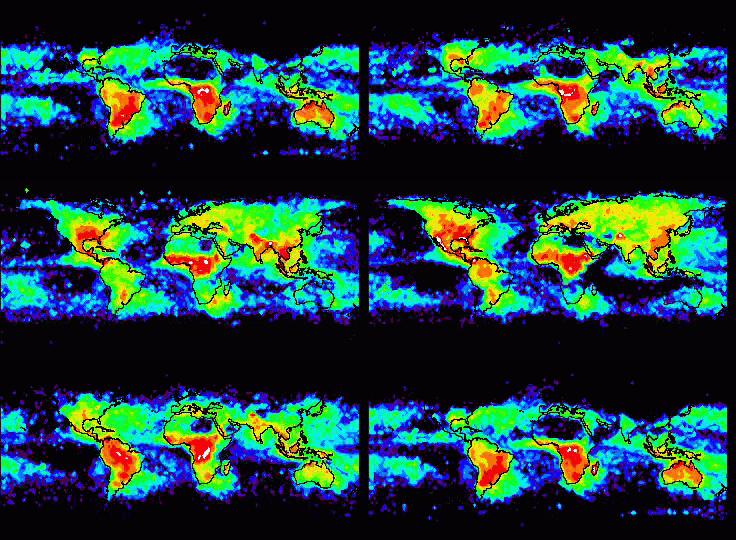
The number of lightning strikes per square kilometre varies dramatically with location and has been studied with the NASA/MSFC Lightning Imaging Sensor.
The yearly variation is shown below and shows most lightning strikes in the Northern Hemisphere during the Northern summer, as expected. This animation was obtained from the National Space Science and Technology Centre


![[lightning stroke image]](lightning-.gif)
![[plots of magnetotelluric field data]](time_series_lightning-.gif)