The Sun's Spectrum
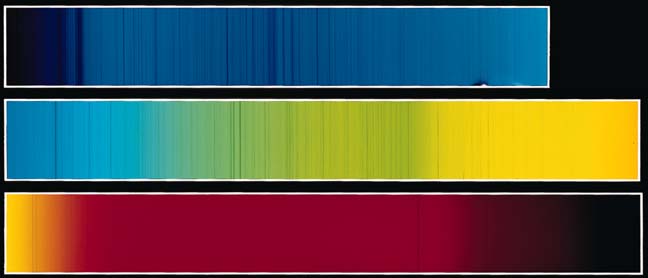
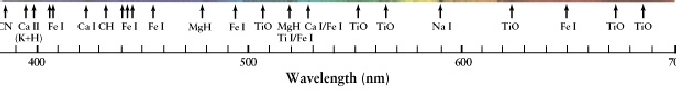
- In 1816, Joseph Fraunhofer passed sunlight through a prism, revealing its spectrum.
- He saw a continuous band of colors just as in a rainbow.
- However, certain colors are missing and one just sees a black line instead.
The Sun's Spectrum
|
|

|
|

|
|
|
|
|
|

|
|
|
|
|
|
|
|
|
Type A |

|
Type B |

|
Type F |

|
Type G |
|
|
Type K |

|
Type M |

|
Type O |
|
|
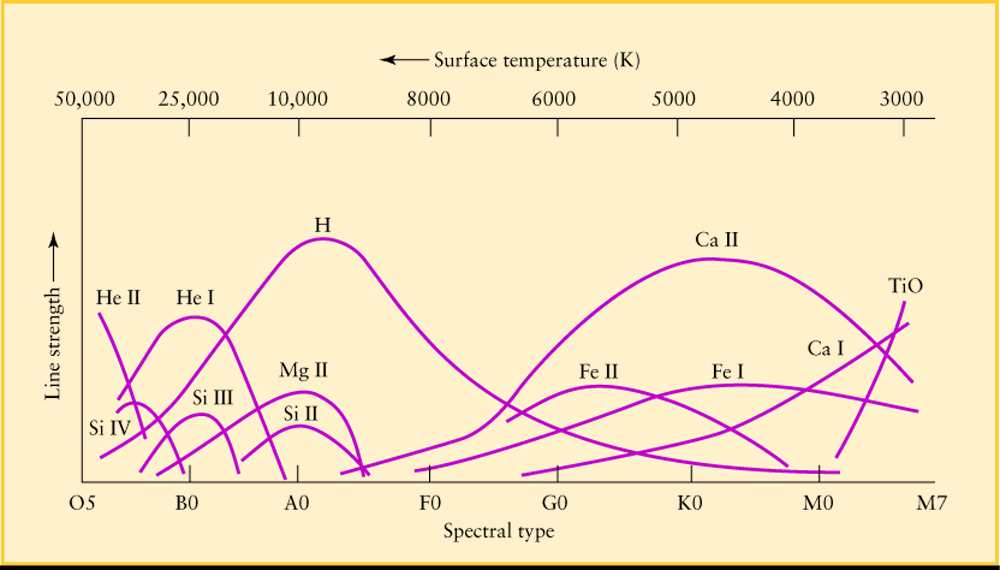
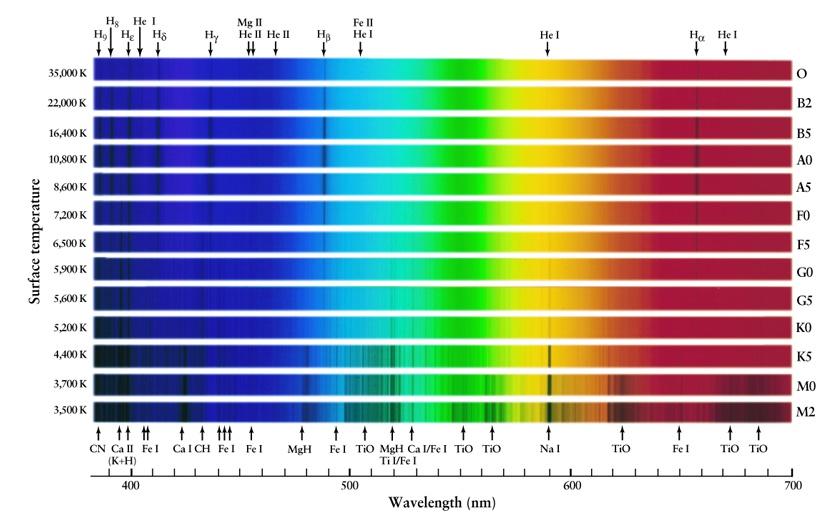
| Type | Temperature | Examples | |
| M0 | 3900 K | Red Stars | Betelgeuse |
| K0 | 5200 K | Hotter than M, so more H absorption than M | Aldebaran, Pollux |
| G0 | 5900 K | Hotter than K, so more H absorption than K | The Sun, Capella |
| F0 | 7500 K | Hotter than G, so more H absorption than G | Procyon, Polaris |
| A0 | 11,000 K | Darkest H Absorption lines | Sirius, Castor, Mizar |
| B0 | 30,000 K | Hotter than A, more H ionization so less absorption than A | Rigel, Regulus |
| O5 | 50,000 K | Hotter than B, most H is ionized so even less absorption | Mintaka (Right-most belt star in Orion) |
|
|
|
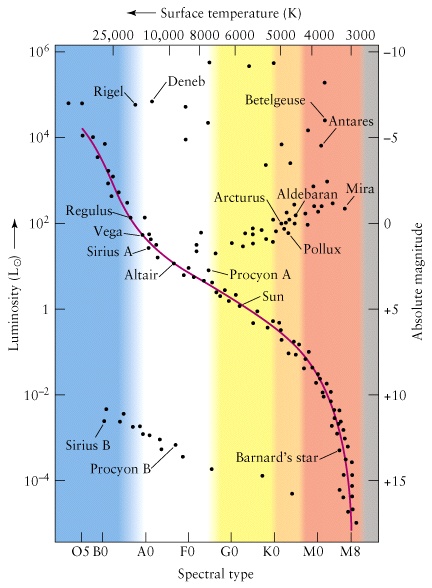 |
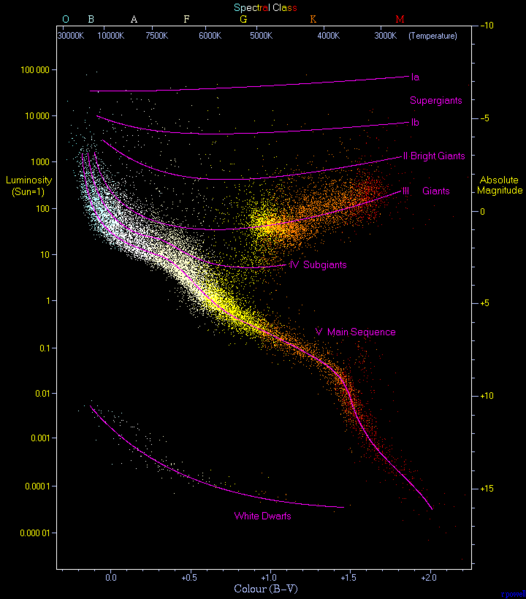
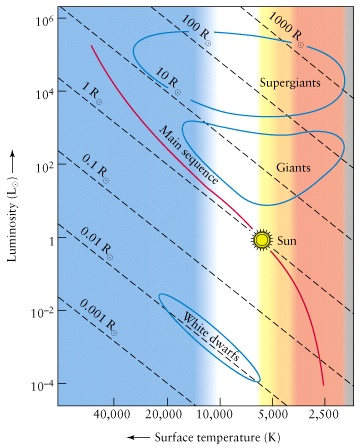
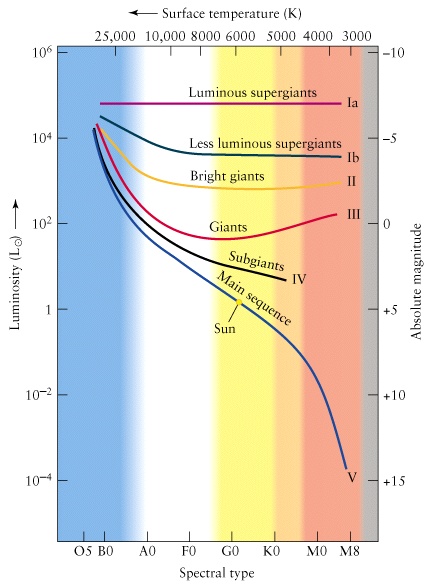
A star's luminosity obeys the Stefan-Boltzmann equationKnowing the luminosity L and temperature T of a star, one can determine its radius ROn H-R diagram the stars
|
|
Luminosity Classes
|
 |