Lecture 10: The Corona, Solar Wind and Magnetic Phenomena


Chapter 16: 8th Ed. pages 414 - 428 or 3rd Ed. pages ???


The Corona

  • A visible light photograph of the Corona during a solar eclipse.
  • It contains extremely hot (> 106 K) but very rarified ( 10-12 less dense than photosphere ) gas
  • Hot gas forms a set of streamers
Figure 16-13
Back Next

The X-ray Corona

  • The Corona emits X-rays.
  • This image corresponds to an electronic transition of highly ionized iron. (Iron stripped of 13 of its electrons.)
  • Iron can only lose 13 electrons and emit this X-ray light if the temperature is more than one-two million K.
  • The dark regions are coronal holes which are lower density than average.
  • The solar wind originates from the coronal holes.
X-ray Image of the Sun
Back Next

The Solar Wind

  • The solar wind is a stream of charged particles (protons and electrons) which flow outwards from the coronal holes.
  • The particles in the solar wind get accelerated up to 200 - 400 km/s.
  • The solar wind particles flow through-out the solar system beyond Pluto.
Solar Wind

Image by LASCO coronagraph on SOHO satellite
Movie of the Solar Wind and Flares
Back Next

Further Evidence for the Solar Wind

  • Photo of Comet Hyakutake
  • A comet's tail always points away from the Sun, no matter in what direction it moves.
  • The particles in the solar wind push outwards on the gas sublimating from the comet so that the tail points away from the Sun.
Photo of comet Hyakutake
Back Next

Aurora

  • When solar wind particles hit molecules in the Earth's atmosphere, they cause the atoms to get excited.
  • The electrons in the excited atoms then jump down to a lower state and give off coloured light.
  • The green and red aurora are usually due to electronic transitions in Oxygen.
  • There is almost always an auroral oval over the Earth's north and south magnetic poles.
  • The size of the auroral oval and the intensity of the emissions depend on the strength of the solar wind.
A photo of aurora


You can check up on the current state of the auroral oval at http://www.phys.ualberta.ca/~morsink/current.html.

Back Next


Solar Flares

  • Solar flares are large outbursts similar to eruptive prominences, but larger and more energetic. (Most flares aren't as large as this one.)
  • Solar flares increase the amount of particles which escape into the solar wind.
  • If the particles ejected from the flare hit the Earth, then we get intense auroral displays.
  • A negative effect is that the solar wind particles can disrupt radio transmissions.
A Flare

Coronal Mass Ejection (Jan. 14, 2002)

  • When an eruptive prominence or a solar flare occurs, a coronal mass ejection (CME) can also take place.
  • A CME is a stream of plasma (charged particles) ejected from the corona.
Back Next

Observation: The Solar Cycle


  • The number and location of sunspots and the severity and number of flares, eruptive prominences and coronal mass ejections are not constant in time.
  • The number of sunspots on the Sun varies on an 11-year cycle. 16-18a
  • As the number of sunspots increases, the number of flares and other forms of activity increases.
  • The luminosity of the Sun also increases when there are lots of spots! (Bright plages also increase when sunspots increase.)
  • The time at which there is a maximum number of spots is called Solar Maximum.
  • The most recent Solar Maximum occurred late in 2000.
  • The period of time from 1645 to 1715 is known as the Maunder minimum was a time with a very low number of sunspots.
  • During the Maunder minimum Europe had colder than usual weather.

Back Next


Predictions about the present sunspot cycle from http://solarscience.msfc.nasa.gov/SunspotCycle.shtml.

Back Next


Observation: Location of Sunspots

  • At the beginning of each 11-year cycle the sunspots appear at high lattitudes.
  • As the cycle progresses, the sunspots appear closer to the equator.
Figure 16-19

Back Next


Observation: Sunspots have strong magnetic field

  • Established by George Hale in 1908 by using Zeeman effect
  • This was also discovery that Sun has magnetic field !
Figure 16-20

Back Next

Observation: Polarity of Sunspots and reversal of Sun's magnetic field

Hale's polarity law
  • In each sunspot pair, one sunspot is a north pole (blue) and the other is a south pole (yellow).
  • Note that in Cycle 21 in the northern hemisphere of the Sun, the north poles are always to the right of the south poles.
  • In the same Cycle, in the southern hemisphere, the south poles are always to the right of the north poles.
  • Every 11 years the polarity of the sunspots and of the whole Sun magnetic field flips.
  • The Sun's magnetic field varies on a 22-year cycle.
Back Next

Theory: A bit about magnetic fields

  • Magnetic fields can be visualized with magnetic field lines . Magnetic field lines are the lines along which small magnets will align themselves when placed in the field.
  • Magnetic field lines go from North to South poles of a magnet, or form closed loops. When visualizing the field, you can draw as many lines as you wish, but you must never drop a line unfinished.
  • Density of the lines signify the strength of the magnetic field. When we follow same neighbouring lines, we speak about flux tube
  • Loops are tighter, stronger is magnetic field. Charge cannot leave magnetic field but if the field is weak and loop is large it does not matter. We often draw just few field lines, to show direction, like here
  • When we have gas of charged particles - plasma, magnetic field gets "frozen in" and is dragged with plasma motions.

Back Next

Model: Flux Tube Model for the Sun's Magnetic Activity

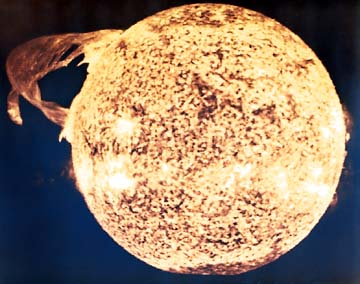
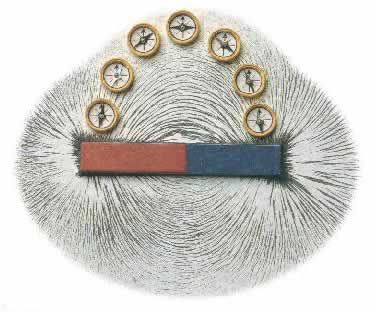
  • The magnetic field lines is "frozen" into the plasma of the Sun and is dragged along when the gas moves.
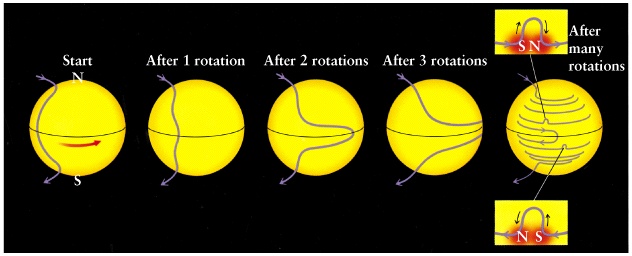
  • Sun gas near equator makes a turn in 25 days, near the pole - in 36 ! 
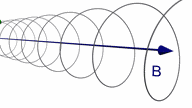
Such differential rotation of the Sun stretches the magnetic field lines into "horizontal" tubes
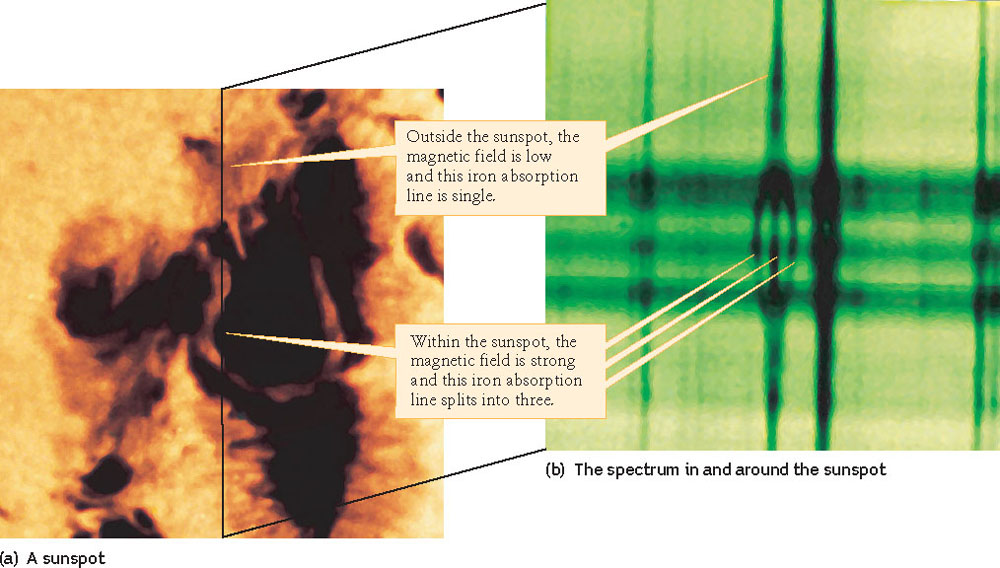
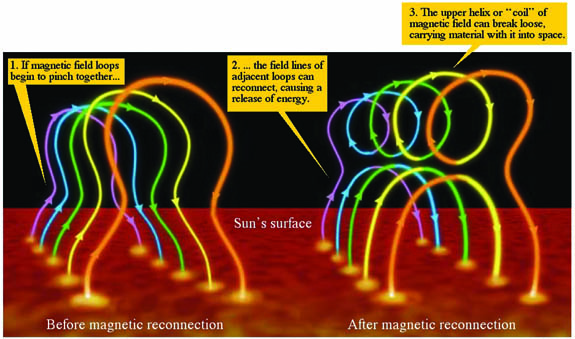
  • Sunspots form when magnetic field near the surface break away from plasma pushing hot gas to the side.
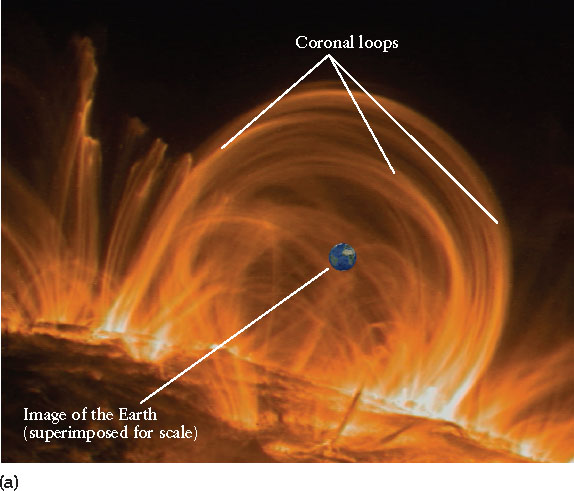
  • This produces loops of magnetic field of the right polarity sticking out of the surface.
Figure 16-23

Back Next

Observation and Model: Magnetic Loops

  • The magnetic field loops are tracks and traps for the charged particles
  • When magnetic field is pinched and twisted, it stores a lot of energy and wants to reconnect into less energetic configuration. Reconnection is very poorly understood, but it is observed.
  • Reconnection produces detached loops and releases large energy that can expell the gas in spectacular flares.
  • Solar Activity increases to the end of the Solar Cycle when magnetic field loops are cramped near equator. We don't why it takes 11 years.
Figure 16-25b Figure 16-25a
Back

Next lecture: The Nature of Stars
Read Chapter 17, 8th Ed. pages 420 - 422 or 3rd Ed. pages 409 - 412.