Citation Maps
Here are a few maps of research fields created through author co-citation analysis and author bibliographic coupling analysis. Details of how these maps were created are provided in our 2008 and 2014 papers published in Journal of the American Society for Information Science and Technology. A brief summary of how to read these maps is provided below.
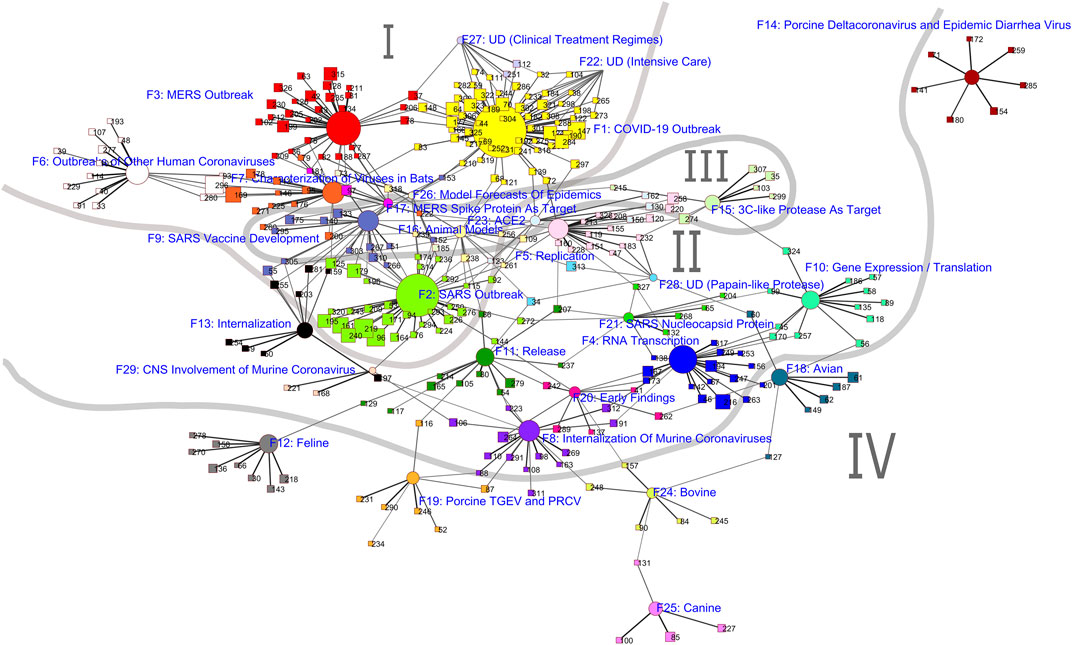
Coronavirus Research
 |
| Intellectual Structure of Coronavirus Research |
Information Science 2011-2020
 |
 |
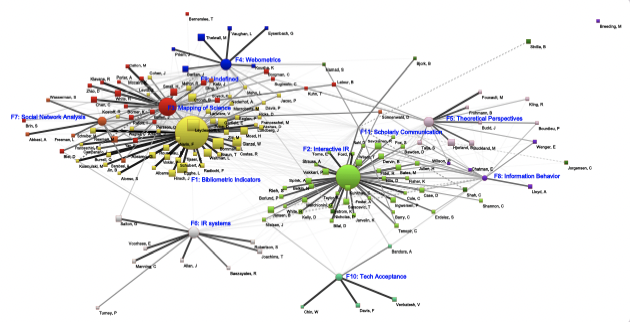
| Intellectual structure of IS 2011-2015 |
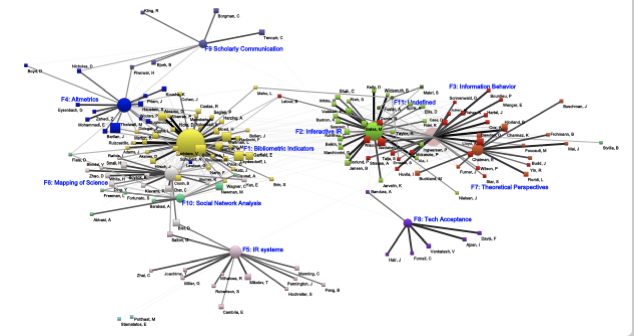
Intellectual structure of IS 2016-2020 |
Information Science 2006-2010
 |
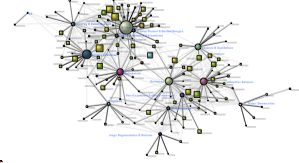 |
| Knowledge Base |
Research Front |
Information Science 1996-2005
 |
 |
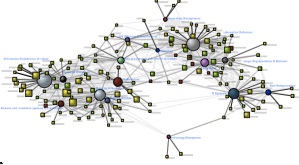
| Structure of Major Specialties |
Authors' Memberships in Specialties |
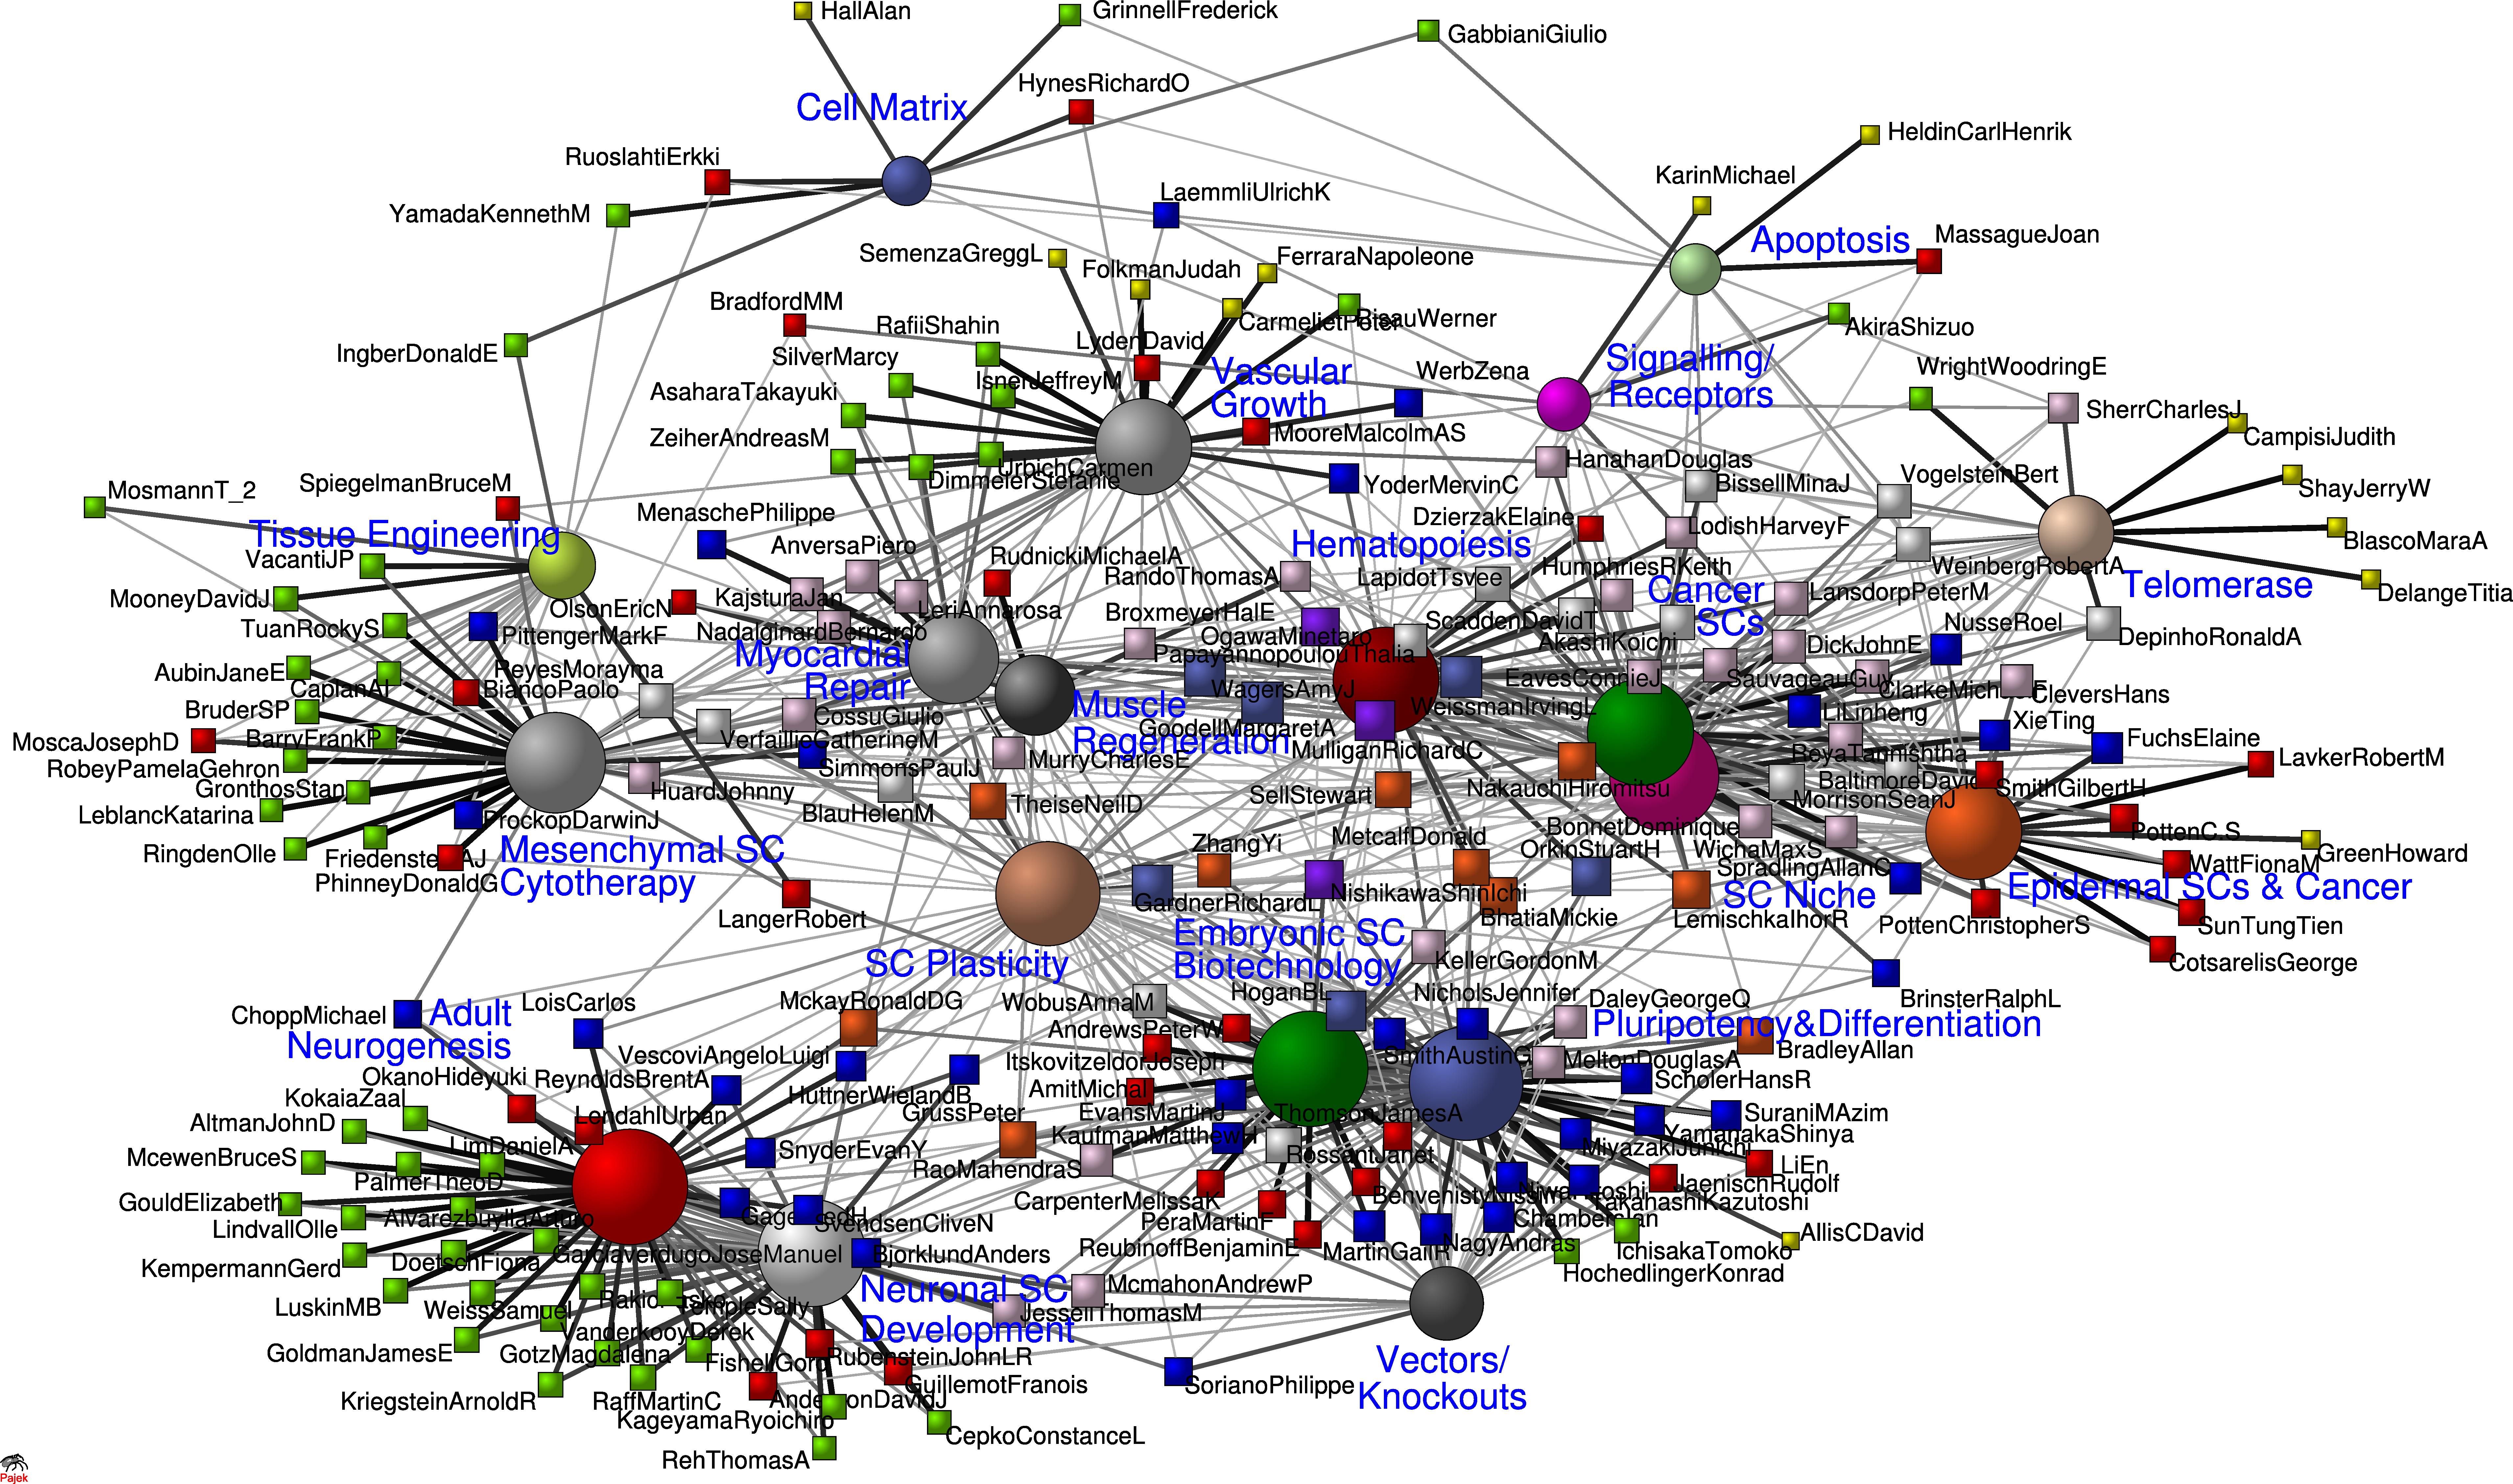
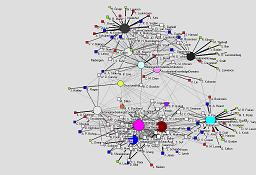
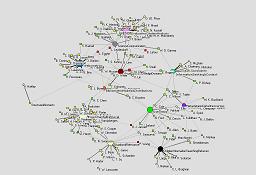
Stem Cell Research 2004-2009
 | 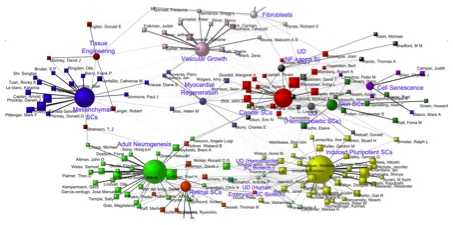 |
| Intellectual Structure | Evolution of Intellectual Structure |
- Data: PubMed records of all articles retrieved by a MeSH term search for "stem cell" for the time period 2004-2009, and their cited references retrieved from Scopus.
- Authors mapped: 200 top-ranked researchers by fractional citation count.
- Sources:
- Zhao, D., & Strotmann, A. (2011). Intellectual structure of Stem Cell research: A comprehensive author co-citation analysis of a highly collaborative and multidisciplinary field. Scientometrics, 87(1), 115-131 (Scientometrics) - left
- Strotmann, A. & Zhao, D. (2011). Evolution of stem cell research 2004-2009: A citation analysis perspective, Stem Cell Europe 2011, July 20-21, 2011, Edinburgh, United Kingdom. Poster presentation. - right
XML research
 |  |
| Structure of Major Specialties | Authors' Memberships in Specialties |
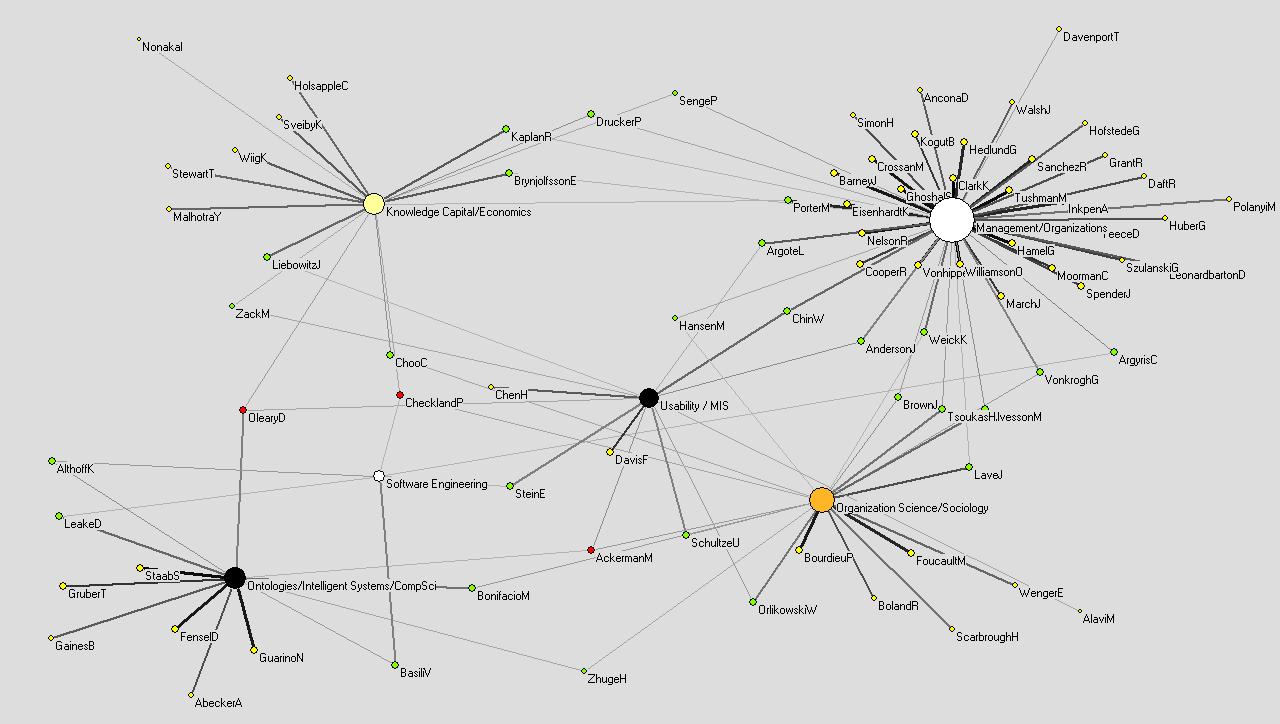
Knowledge Mangement
 |
Major Specialties and
Authors' Memberships in Specialties |
- Data: Web of Science records of all articles retrieved by a topic search for "Knowledge management" for the time period 2001-2006.
- Authors mapped: 80 most highly cited.
- Source: work in progress.
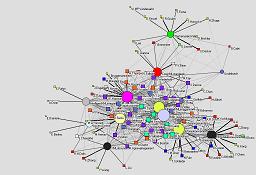
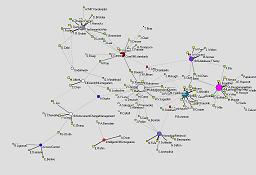
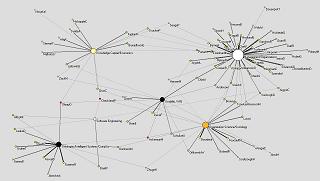
The circular nodes represent specialties and the square nodes authors. The size of a specialty node is an approximate indicator of its overall significance in the map. The color of an author node indicates the number of specialties in which this author has membership: yellow for authors who only have membership in a single specialty, green for two specialties, red for three, and blue for four specialties.
The width and the greyscale value of lines connecting nodes represent the degree of relatedness, with darker and thicker lines representing closer ties. Dashed lines represent counter-relationships, i.e., dissimilarities.
On more recent maps (i.e., information science 2006-2010), the size of an author node is determined by citation count, and indicates the author's citation impact on the research field. The foreground links indicate unique contributions of author to research area, and background links represent a combination of unique contributions of author to research area and the correlation between research areas.