J Pharm Pharmaceut Sci (www.cspscanada.org) 9(3):359-364, 2006
Single Dose Pharmacokinetics and Bioavailability of Butyryl Glucosamine in the Rat
Ali Aghazadeh-Habashi1, Alyaa Ibrahim1, John Carran2,3, Tassos Anastassiades2 and Fakhreddin Jamali1
Faculty of Pharmacy and Pharmaceutical Sciences, University of Alberta, Edmonton AB, T6G 2N8, Department of Medicine, Queen’s University, Kingston, ON, Canada, Department of Chemistry, Queen’s University, Kingston, ON, Canada.
Received: September 20, 2006; Revised, November 26, 2006; Accepted November 29, 2006; Published, November 30
Corresponding Author:Dr. F. Jamali, Faculty of Pharmacy and Pharmaceutical Sciences, University of Alberta, Edmonton AB, T6G 2N8. Canada fjamali@ualberta.ca
ABSTRACT -- Purpose. To study single dose pharmacokinetics and bioavailability of the synthetic glucosamine analogue, N-butyryl glucosamine (GLcNBu) after different routes of administration, and also the effect of food following oral doses of GLcNBu in the rat, and stability and absorption of GLcNBu across the rat everted intestine. Method. GLcNBu was administered intravenously (i.v.), intraperitonealy (i.p.) and orally. Effect of food was studied following oral administration only. Single doses of 223 mg/kg were administered in all cases. Serial blood samples were collected from the jugular vein for GLcNBu determination. Everted excised rat intestine segments were suspended in Tris buffer at 37º C and samples collected from both serosal and mucosal sides. GLcNBu was measured using HPLC. Result. Following i.v. administration, the terminal half-life was 0.29 ± 0.06 h, volume of distribution at steady state was 2.1 ± 0.26 L/kg and total body clearance was 5.23 ± 1.44 L/h/kg. Bioavailability was less than 17% and 100% following oral and i,p. doses respectively. GLcNBu was rapidly absorbed after oral doses (Tmax, 29-40 min). Food had no significant effect on the pharmacokinetics of GLcNBu. There was no evidence of breakdown of GLcNBu in the presence of everted intestine. The mucosal to serosal transport of GLcNBu was about 20% after 2 h incubation. Conclusion. GLcNBu has rapid but low absorption and is widely distributed and efficiently cleared. The gut rather than liver is mainly responsible for the low bioavailability of GLcNBu. Limited absorption of GLcNBu suggests a transport dependent absorption. Food does not significantly affect the bioavailability of GLcNBu.
INTRODUCTION
Glucosamine (GlcN) is commonly used as a nutraceutical compound by arthritis patients (1) but its mode of action is still unknown and there is still controversy about its clinical efficacy (2). The low bioavailability of GlcN after oral administration is a drawback of its usefulness as very large doses are needed for beneficial effects (3). Recently, N-acylated-GlcN analogs with different lengths of alkyl chains have been studied for their potential effects on both cartilage and bone. N-butyryl glucosamine (GLcNBu) appears to increase the levels of collagen and help chondrocytes to offset the shutdown of the collagen gene expression induced by inflammation (4). After six days of incubation of chondrocytes with GLcNBu, significant increases in concentration of type II collagen and aggrecan mRNA have been observed (4). Similarly, preliminary results of the treatment following oral administration of GLcNBu (20-200 mg/kg/day) in osteoarthritis animal models have shown beneficial effects (5). Recent results in an inflammatory arthritis model with orally fed GlcNBu demonstrated protection of cartilage loss, local bone loss and decrease in the inflammatory measures (5, 6).
There is no report on pharmacokinetics of GLcNBu except for a plasma concentration-time curve following oral administration of the drug to the rat (7). Herein, we are reporting a detail study of the pharmacokinetics of GLcNBu following different routes of administration to the rat, the effect of food, and the fate of the drug incubated with isolated perfused intestinal tissues. Rat has been extensively used as a model for gastrointestinal absorption of drugs (8).
MATERIALS AND METHODS
Materials
N-butyryl (D) glucosamine (GLcNBu) was supplied by the Department of Medicine, Queen’s University (Kingston, ON, Canada). D (+) fucose and 1-phenyl-3 methyl-5- pyrazolone (>95%) were purchased from Sigma Chemical Company (St. Louis, MO. USA). Methanol and acetonitrile were purchased from Caledon Laboratory Ltd (Georgetown, ON. Canada). All standard solutions and the mobile phase were prepared in double distilled water from Caledon Laboratory Ltd (Georgetown, ON. Canada). Triethylamine and acetic acid were purchased from BDH Inc. (Toronto, ON. Canada). All other chemicals and solvents were commercial products of analytical or HPLC grades.
Animals
The study protocol was approved by the University of Alberta Animal Care Committee. For the pharmacokinetic experiments (n=4-6/group), adult Male Sprague Dawley rats (288±19 g) were used. For i.v. drug administration and blood sampling, animals were cannulated in the right jugular vein. Silastic catheters (0.58 mm i.d. x 0.965 mm o.d.; Clay Adams, Parsippany, NJ. USA) were surgically implanted while the animals were under anesthesia with halothane. They were allowed to recover overnight. They had free access to food and water throughout the experiment. All doses were 223 mg/kg GLcNBu (dissolved in saline) administered between 8-10 a.m. This dose given daily, has been shown to be effective in osteoarthritis animal models (5, 6). Intravenous doses were injected via catheter and 0.5 mL of normal saline was subsequently injected to rinse the catheter. Other parenteral doses were injected intraperitoneally. Oral doses of GLcNBu were gently gavaged. Blood samples (approximately 0.2 ml) were collected from the jugular vein catheter into a heparinized tube at 0, 5, 10, 15, 30 min, 1, 1.5, 2, 3, 4 and 6 h post-dose. Plasma was immediately separated by centrifugation and stored at –20˚C until analyzed. To investigate the effect of food, another group of rats (Fasted n=5) were kept in metabolic cages to prevent from eating of the bedding and feces. They had free access to water but were deprived of food for 12 h prior to drug administration. The fasted rats received single oral doses of GLcNBu. Food was regular oval pellets with controlled amounts of crude protein (23%), crude fat (4.5%), crude fiber (6%), ash (8%) and added mineral (2.5%).
Transport Study in Everted Intestinal Sacs
Three rats (420±15 g) were anesthetized with halothane. Abdominal incision was made and 10 cm segment of intestine approximately 10 cm below the pyloric sphincter were removed. Subsequently animals were euthanized. The segments were everted using a glass rod after rinsing with cold Kerbs-Henesleit bicarbonate buffer (118 mM NaCl, 4.75 mM KCl, 2.50 mM CaCl2, 1.19 mM KH2PO4, 1.19 mM MgSO4, 25 mM NaHCO3, and 11 mM Dextrose, pH 7.4). One end of the everted sac was ligated with silk thread and a silastic catheter (0.58 mm i.d. x 0.965 mm o.d.) was inserted into the other end and tied. The segments were filled with Kerbs-Henesleit bicarbonate buffer and placed in perfusion chamber containing 20 µg/mL of GLcNBu (total volume, 40 mL) of same buffer which was continuously aerated with O2/CO2 (95/5) at 37° C. Aliquots of 0.5 mL from both serosal and mucosal solutions were collected at 0, 30, 60 and 120 min and the fluid lost was replaced by the same volume of buffer.
Stability of GLcNBu in the Presence of excised Gastrointestinal tissues
Three rats (353.7 ± 3.5 g) were anesthetized using halothane. Through an abdominal incision stomach and intestine were excised. They were rinsed with cold Krebs buffer (pH 7.4). Each tissue was cut into small pieces using a pair of sharp seizers. The tissues were transferred to jacketed chambers containing 40 mL of either simulated gastric fluid (2g NaCl, 7 mL HCl and pepsin 3.2 g, pH 1.2) for stomach and Krebs buffer for intestine both containing 40 ug/mL GLcNBu. The temperature of the incubation fluid was raised to 37° C while it was aerated with O2/CO2 (95/5) and maintained at that temperature throughout the experiment. Subsequently, aliquots of 0.5 mL were sampled at 0, 30 and 60 min and kept at –20o C until analyzed for both GLcNBu and GLcN. Following each sample collection equal volume of fresh medium was added to the chamber. Control experiments were carried out under identical conditions but without gastrointestinal tissues.
Assay of GLcNBu and GlcN
GLcNBu plasma and perfusion medium concentrations were assayed using a previously described HPLC-UV method (7). Briefly, aliquots of 0.1 mL of blank rat plasma or perfusion medium were spiked with 20 mL of 50 mg/mL fucose aqueous solution (internal standard) and various GLcNBu standard solutions in 1.5 mL Eppendorf tubes to obtain concentrations of 0.2- 200 mg/mL of the drug. To this solution was added 100 ml of a methanolic 0.5 M solution of 1-phenyl-3-methyl-5-pyrazolon, which was premixed with an equal volume of 0.3 M sodium hydroxide. The resultant solution was heated at 70o for 30 min. Subsequently, the solution was cooled to room temperature and neutralized with 0.3 M hydrochloric acid. Then 0.2 mL of phosphate buffer (pH 2.5) was added, vortex-mixed for 30 s and centrifuged at 19000 g for 1 min. The supernatant was separated from the precipitated plasma residual and transferred into a 1.5 mL Eppendorf tube. To remove the excess derivatizing reagent as well as other unwanted compounds, the resultant aqueous solution was subjected to extraction three times with 0.3 mL chloroform followed by vortex mixing for one min and centrifuging at 19000 g for 30 s. The upper aqueous layer, which contained GLcNBu, was separated, and 0.1 mL of it was injected into an isocratic HPLC system with a Synergi Hydreo-RP 80 Ǻ polar endcapped C18 analytical column (Phenomenex, Torrance, CA, USA), a mobile phase of pH 7 phosphate buffer:acetonitrile (80:20), a flow rate of 1.0 mL/min, and a UV detector set at 245 nm. The lower limit of quantification was 0.2 μg/mL. The assay was linear over a tested range of 0.2-200 μg/mL with the linear correlation coefficient of >0.99. The intra-inter day precision for this assay was <11.4 %.
The quantitative measurement of GlcN in plasma samples was performed using a previously described HPLC-UV method (9). Briefly, the internal standard, galactosamine, was added to 100 µL of plasma containing GlcN followed by precipitation of plasma proteins with acetonitrile. Evaporation of the decanted supernatant solution was accelerated by the addition of methanol. GlcN was derivatized by addition of a solution containing 1-naphthyl isothiocyanate. Sample cleanup included passage through an anion exchange cartridge. Analysis was accomplished by injection of 0.1 mL of the sample solution into an isocratic HPLC system consisting of a C18 column, a mobile phase of acetonitrile: water: acetic acid: triethylamine (4.5: 95.5:0.1:0.05), a flow rate of 0.9 mL/min, and a UV detector set at 254 nm. The limit of quantification of the method was 1.25 mg/L. The assay was liner over a plasma concentration range of 0.5-400 μg/mL. The intra- and inter day variation was <14.0 %.
Pharmacokinetic Analysis
Pharmacokinetic indices were calculated using a non-compartmental method (WinNonlin, version 4.1,Pharsight Corporation, CA). The area under the plasma concentration-time curve (AUC0-t) was calculated using the trapezoidal rule from 0 to the last measured plasma concentration (Clast). The terminal elimination rate constant, β, was estimated using the linear least square regression of the log-linear phase of the concentration-time carves considering the last four experimental points. AUC0-∞ was calculated by adding Clast / β to AUC0-t. The total body clearance, ClTB, was determined by dividing the i.v. dose by AUCi.v. The steady state volume of distribution, Vdss, was calculated from: Vdss=dose.MRT/AUCi.v., where MRT= AUMCi.v / AUCi.v, is the mean residence time and AUMCi.v is area under the first moment curve after i.v. administration (10). The highest observed concentration and corresponding sampling time point were defined as the peak plasma concentration (Cmax) and time-to-peak concentration (Tmax), respectively. The above indices were determined for each individual animal and their mean was calculated. Absolute bioavailability (F) was calculated by dividing mean AUC0-∞ generated following p.o. or i.p by that after the i.v. doses.
Compartmental modeling was performed using WinNonlin, version 4.1. Plasma concentrations were fit to one and two-compartment models. First-order absorption and lag times were also evaluated in the fitting of oral and i.p. data. Due to the rapid absorption noted, lag times were fixed at 0 in the models. Model discrimination was determined using Akake’s information criterion (AIC) and goodness of fit (r2).
Statistics
All the values are expressed as mean ± standard deviation. Statistical significance between the means of groups was examined using the ANOVA and it was set at p < 0.05.
RESULTS
As depicted in Figure 1, following i.v. doses, GLcNBu pharmacokinetics was described by a two-compartment open model. For i.p. and oral doses, however, the best fits were achieved when the one compartment open model with first order input was used.
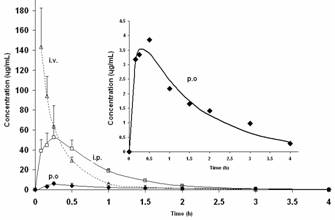
Figure 1. (A) Mean plasma concentration versus time curves of GLcNBu following different routes of administration. The insert is the enlarged curve following oral administration. Error bars are the standard deviations of the means of 4-6 rats. Symbols are the experimentally observed data points and lines are the best estimated fit.
GLcNBu is rapidly absorbed as the mean Tmax is achieved in less than 30 min after both oral and i.p. doses (Table 1). The drug is highly distributed with a Vdss of approximately 2 L/kg. The absolute bioavailability following oral doses was only 0.15-0.17. The i.p. doses, on the other hand, were completely bioavailable (Table 1, Figure 1). There was no significant difference between the three routes of administration in the mean terminal elimination t½ of GLcNBu which ranged from 17 to 26 min. No GlcN was detected in any of the analyzed samples collected following administration of GLcNBu regardless of the route of administration.
The mean plasma concentration-time profiles after single oral doses of 223 mg/kg of GLcNBu in fasted and fed animals are illustrated in Figure 2. Food did not significantly influence pharmacokinetics of GLcNBu (Table 1). GLcNBu concentration in serosal side and percent remaining in mucosal side over time are depicted in Figure 3. Approximately 20% of GLcNBu is absorbed. There was no trace of GlcN at the serosal or mucosal side. GLNcBu was stable after 60 minutes incubation with excised stomach and intestinal tissues as 100% of the added drug was found and no trace of GLNc was detectable during the incubation period.
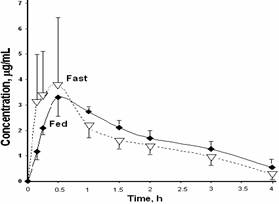
Figure 2. Mean GLcNBu plasma concentration-time curves after oral administration of single 233 mg/kg doses to fasted (n=5, dotted line) and fed (n=6, solid line) rats. Error bars represent standard deviations of the means.
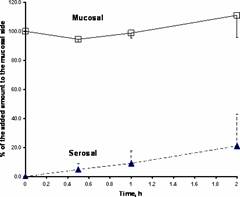
Figure 3. The time course of GLcNBu in the rat mucosal and serosal everted intestinal sacs. The data (%, mean) represent the mean±standard deviation of the amount of drug added to the mucosal side (n=3).
Table 1. Pharmacokinetic indices of GLcNBu after i.v., i.p. and oral administration to the rat |
|||||
|
i.v. |
i.p. |
p.o (Fasted) |
p.o. (Fed) |
|
Cmax (μg /mL) |
nd |
53.2 (10.8) |
4.60 (2.36) a |
3.56 (0.51) a |
|
T max (min) |
nd |
18.8 (7.5) |
28.9 (19.6) |
40.0 (15.5) |
|
AUC0-t (μg.h.mL-1) |
46.4 (11.0) |
48.8 (7.5) |
6.42 (1.71) a |
6.86 (1.18) a |
|
AUC0-∞ (μg.h.mL-1) |
46.5 (11.0) |
48.9 (7.4) |
7.06 (1.85) a |
7.76 (1.47) a |
|
t 1/2 (min) |
17.4 (3.6) |
24.6 (4.8) |
21.0 (9.6) |
26.4 (7.2) |
|
Vdss (L/kg) |
2.1 (0.26) |
nd |
nd |
nd |
|
ClTB (L/h/kg) |
5.2 (1.44) |
nd |
nd |
nd |
|
AUMC (h2. μg/mL) |
17.3 (5.2) |
35.6 (5.9) |
12.8 (4.3) |
16.0 (5.7) |
|
MRT (h) |
0.37 (0.05) |
0.73 (0.08) |
1.78 (0.19) a |
2.01 (0.48) a |
|
F |
1.00 |
1.05 |
0.15 |
0.17 |
|
Data represent mean ± (SD) of 4-6 rats; nd, not determined; a significantly different from i.v. route (p<0.05). |
|||||
DISCUSSION
GlcN is usually administered in large doses (3g/day) (3). This is attributed to a low oral bioavailability (F) based on data generated using rats (F, 0.19-0.21) (11). Our present data suggest that GLcNBu shares with GlcN the characteristics of a drug with limited bioavailability (F, 0.15-0.17) (Table 1). In addition, similar to GlcN, the absolute bioavailability of GLcNBu following i.p doses, is complete. In the context of bioavailability, the main difference between the p.o and i.p doses, is the fact that the latter bypasses the gastrointestinal tract. Both i.p. and p.o. doses, on the other hand, pass through the liver. A complete bioavailability following i.p. doses, but low bioavailability after p.o. doses, therefore, pinpoints the gastrointestinal tract as the site of presystemic loss of the drug. Hence, the observed low oral bioavailability of both GLcNBu (Table 1) and GlcN (10) appears to be due to their poor gastrointestinal absorption and/or breakdown in the tract. GlcN, a highly soluble drug, has been reported to be a substrate for the low glucose transportation (12). This may indicate a gastrointestinal transporter-limited bioavailability for GlcN, although a limited parallel passive diffusion through the gut cannot be ruled out.
Interaction between food and drugs may result in altered pharmacokinetics and pharmacodynamics (13). This is more important for drugs with poor bioavailability due to factors involved in the gastrointestinal tract since the possibility of physical food and drug interactions become greater. According to our data, GLcNBu pharmacokinetics are not different between rats with free access to their regular food and those deprived from the latter for 12 h (Table 1, Figure 2). This suggests that the presence of food may not explain the poor bioavailability of GLcNBu.
After incubation of GLcNBu with everted intestine for 2 h, only 20% of the drug is found to cross the membrane (Figure 3). However, the appearance of GLcNBu in plasma following oral administration to the fasted rats was rather quick (Mean Tmax, 29-40 min). This indicates that, although limited in extent, the amount that bypasses the gut and the liver reaches the systemic circulation rapidly. Hence, a 2 h incubation period is expected to yield greater than 20% absorption through everted intestine unless the kinetics of drug absorption is not predominantly passive and/or the drug is broken down in the gastrointestinal tract. The possibility of a chemical or enzymatic breakdown of GLcNBu in intestine can be reasonably ruled out since GLcNBu remains intact during the incubation period (Figure 3). Incubation of GLcNBu in the presence of excised stomach tissues also failed to yield GLcN.
Regardless of the route of administration, none of the administered doses of GLcNBu resulted in any detectable concentration of GlcN. GlcN was also not detected in the everted intestine preparations exposed to GLcNBu. It appears that the butyryl alkyl chain on the amino group is not cleaved to produce GlcN either in the systemic circulation or in the presence of excised intestine. Hence, it may be concluded that GLcNBu is not bio-converted to GlcN at least above our assay detection limit. Our assay of GlcN has limited quantitative sensitivity (1.25 µg/mL). It can, however, qualitatively detect trace amounts of GlcN at much lower levels than 1.25 µg/mL. In addition, with the everted intestine, the possibility of detecting GlcN is greater than in live animals since a relatively high GLcNBu concentration (20 µg/mL) is added and higher sample volumes can be collected for analysis. Nevertheless, we cannot equivocally rule out the formation of very small quantities on GlcN following administration of GLcNBu. However, in the absence of measurable generation of GlcN following exposure to GLcNBu, intrinsic pharmacological activity for the latter is a possibility.
In conclusion, GLcNBu has rapid but low absorption by oral administration and is widely distributed and efficiently cleared. The low bioavailability is likely due to an inefficiency of the gastrointestinal transport system. This is particularly important since, relatively large doses of both GLcNBu and glucosamine are used via the oral routes. The presence of food does not influence pharmacokinetics of GLcNBu. Since, no measurable concentration of glucosamine is found upon exposure to GLcNBu, the biological activity of GLcNBu appears to be an intrinsic effect independent of glucosamine. The present data indicates the need for more detail investigation to characterize the absorption of the drug.
ACKNOWLEDGMENTS
This work has been supported by the National Science and Engineering Research Council through grant STPGP #246039-01.