J Pharm Pharmaceut Sci (www.ualberta.ca/~csps) 2 (2):47-52, 1999
|
|||||||||||||||||||||||||||||||||||||||||||||
Cytochrome P450 3A4 In Vivo Ketoconazole Competitive Inhibition: Deterination of Ki and Dangers Associated with High Clearance Drugs in General Received manuscript April 13th, 1999; Revised May 21st, 1999; Accepted May 21st, 1999. Harold Boxenbaum1, PDF Version for printing Abstract Assuming complete hepatic substrate metabolism and system linearity, quantitative effects of in vivo competitive inhibition are investigated. Following oral administration of a substrate in the presence of a competitive inhibitor, determination of the inhibition constant (Ki) is possible when plasma concentration-time profiles of both substrate and inhibitor are available. When triazolam is the P450 3A4 substrate and ketoconazole the competitive inhibitor, Ki ~ 1.2 m g/mL in humans. The effects of competitive inhibition can be divided into two components: first-pass hepatic metabolism and systemic metabolism. For drugs with high hepatic extraction ratios, the impact of competitive inhibition on hepatic first-pass metabolism can be particularly dramatic. For example, human terfenadine hepatic extraction goes from 95% in the absence of a competitive inhibitor to 35% in the presence of one (ketoconazole, 200 mg po Q 12 h dosed to steady-state). First-pass extraction therefore goes from 5% in the absence of the inhibitor to 65% in its presence. The combined effect on first-pass and systemic metabolism produces an approximate 37 fold increase in terfenadine area under the plasma concentration-time curve. Assuming intact drug is active and/or toxic, development of metabolized drugs with extensive first-pass metabolism should be avoided if possible, since inhibition of metabolism may lead to profound increases in exposure. In a linear system (assumed throughout), area under a drug plasma concentration-time curve (0 - ¥) and average steady-state plasma concentration, respectively, are given by (1-2): where AUC(0 - ¥ ) is area under the plasma concentration time-curve from 0 to infinity, F is absolute bioavailability, D is dose, CL is clearance, Cav is average steady-state drug plasma concentration, t is dosage interval and CL is clearance. Note that the right hand sides of both equations are identical except for t ; consequently the principles discussed below are applicable to both equations. For an orally administered drug completely metabolized by the liver (also assumed throughout), Eq. 1 may be rearranged to (3-4):
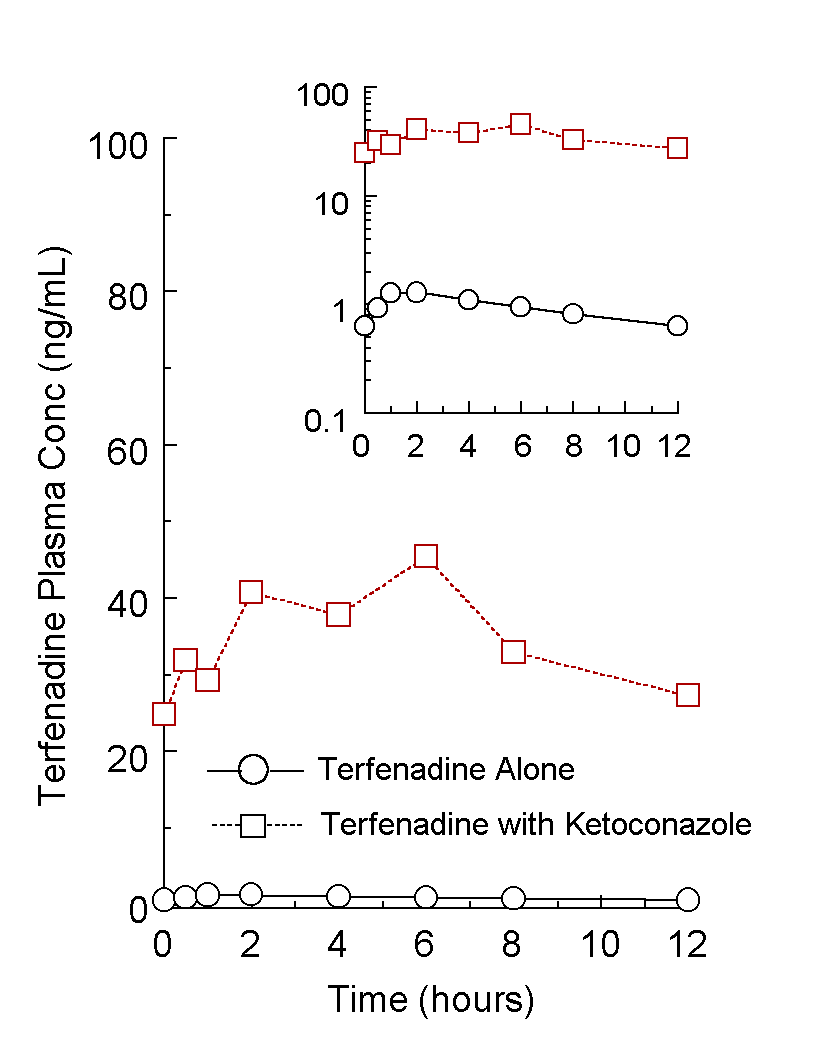
where FL is the fraction of dose available to the liver (due to biopharmaceutic factors, gut motility, etc), ER is hepatic extraction ratio and QH is hepatic blood flow (a QH of 25 mL/min/kg (5) is assumed throughout). Assuming FL, D and QH remain constant, AUC(0-¥ ) and Cav are proportional to (1-ER)/ER. Consequently, to evaluate the effects of a competitive inhibitor of drug metabolism on these two variables following oral administration, one need only calculate this ratio. Figure 1 illustrates human steady-state terfenadine plasma concentration-time profiles following oral terfenadine administration (60 mg q 12 h) administered alone and concomitantly with 200 mg po ketoconazole q 12 h for 13 doses. Inasmuch as terfenadine is completely and almost exclusively metabolized by CYP 3A4, and ketoconazole is a competitive inhibitor of this enzyme (8), ketoconazole reduces ER. The relative bioavailability is the ratio of (1-ER)/ER under these two dosing conditions. Area analysis of the data illustrated in Figure 1 indicated the relative bioavailability of terfenadine increased 37.4 fold in the presence of ketoconazole. Assuming FL is 0.4 (9), terfenadine’s ER administered alone was calculated from Eq 3 as 0.953. Under the influence of ketoconazole, ER was reduced to 0.350. Inasmuch as rate of metabolism is proportional to CL, and CL is proportional to ER, percent inhibition of ER may be expressed as (8, 10-11):
where, assuming no active inhibiting metabolites, (I) is either inhibitor plasma concentration, unbound plasma concentration, amount of drug in the body or steady-state dose-rate, Ki is the inhibition constant, ERALONE is extraction ratio when drug is administered alone and ERINHIBITOR is extraction ratio under the influence of inhibitor. When (I) is steady-state dose, it is inherently assumed dose-rate produces a relatively stable steady-state plasma concentration. Figure 1. Steady-state, intact terfenadine plasma concentration-time profiles following an oral regimen of 60 mg Q 12 h to a 70 kg human subject with and without concomitant ketoconazole (200 mg po Q 12 h). The profile without ketoconazole was simulated (Professional WinNonlin, Pharsight Corp, Cary NC, v. 2.1, 1998, model 12) from parameters derived from Lalonde et al (6) for a two-compartment open model with elimination solely from the central compartment, first-order input, first-order output and a lag time. Variables and parameters inputted into model 12 of Professional WinNonlin were: D = 60 mg/70 kg po Q 12 h dosed to steady-state; CL/F = 75.48 L/h/kg; K01 (absorption rate constant) = 2.80 h-1 ; LT (absorption lag time) = 0.33 h; a = 0.156 h-1 ; b = 0.0459 h-1 (corresponding to a terminal exponential half-life of 15.1 h); K12 = 0.03122 h-1 ; K21 = 0.09643 h-1 ; K10 (elimination rate constant) = 0.07425 h-1; and V1/F = 1017 L/kg. The profile with ketoconazole (7) was digitized from a representative subject and normalized for a 70 kg individual. The ratio of steady-state AUC (over a dosing interval) was 37.44, corresponding to ER values of 95.27 and 34.96%, respectively, for terfenadine administered alone and with ketoconazole. See text for discussion.b = 0.0459 h-1 (corresponding to a terminal exponential half-life of 15.1 h); K12 = 0.03122 h-1 ; K21 = 0.09643 h-1 ; K10 (elimination rate constant) = 0.07425 h-1; and V1/F = 1017 L/kg. The profile with ketoconazole (7) was digitized from a representative subject and normalized for a 70 kg individual. The ratio of steady-state AUC (over a dosing interval) was 37.44, corresponding to ER values of 95.27 and 34.96%, respectively, for terfenadine administered alone and with ketoconazole. See text for discussion.Based on the terfenadine data discussed above, Eq 4 was solved for ketoconazole Ki expressed as dose-rate. The value obtained was 232 mg/day; this would indicate that this steady-state dose-rate would produce a 50% inhibition of drug substrate rate of metabolism, CL and ER. For pure enzyme products, percent inhibition is independent of substrate (11), although this may be a dangerous assumption in microsomal (heterogeneous) enzyme systems and especially under in vivo conditions. Table 1 compares calculated and observed % inhibition values for 4 drugs using this method; reasonable predictions are observed. The utility, accuracy, etc. of using Ki, expressed as a daily-dose, will of course depend on the use to which it is put. Quantitation of a concentration-based Ki may be achieved through plasma concentration-time data in the presence and absence of competitive inhibitor via the following relationship:
where C is the interpolated plasma concentration between two data points, I is inhibitor plasma concentration at the same time as C (interpolated if necessary), CL is drug clearance following completion of inhibitor, (CL)((Ki/(Ki + I)) is clearance in the presence of inhibitor, and V1 is volume of the central compartment. Equation 5 is only valid following completion of first-pass metabolism. Following oral dosing in which there is a metabolic first-pass effect, it may therefore be utilized after absorption is complete. Using nonlinear regression analysis, rate of change of plasma concentration (left hand side of Eq 5) may be fitted to plasma concentration-time data, preferentially simultaneously both in the presence and absence of inhibitor. There are variations on how best to do this, but consider just one generalized method. Simply iterate CL, V1 and Ki while fitting Eq 5 to data in the presence and absence of inhibitor. Rowland and Matin (10) were apparently the first investigators to utilize this generalized approach. Table 1. Calculated and Observed Percent Inhibition of ER Values by Ketoconazole on 4 Drugs Administered to Human Subjects a
aObs = observed; % Inhib = percent inhibition by ketoconazole; and keto = ketoconazole. ER was calculated assuming a hepatic blood flow of 25 mL/min/kg, and observed percent inhibition of ER values were calculated from the extreme right-hand term of Eq 4. Predicted percent inhibition ER values (middle term, Eq 4) were calculated from [((100)(daily keto dose))/((daily keto dose) + (232 mg/day)), where 232 mg/day is the calculated Ki (see text). Data came from the following sources: cyclosporin (12); tacrolimus (13); triazolam (14); and alprazolam (14). bCyclosporine dose = 2 mg/kg IV infusion over 2.5 h; keto dose = 200 mg/day po x 9 days. cTacrolimus dose = 0.025 mg/kg IV infusion over 4 h before keto, and 0.01 mg/kg IV infusion over 4 h after keto; keto dose = 200 mg po at bedtime x 12 days. dTriazolam dose = 0.25 mg (tablet) single-dose; keto dose = 200 mg po AM and PM x 5 doses. Blood to plasma concentration ratio (B/P) was calculated assuming unbound drug concentration in plasma and blood cells were equal, according the following equation: B/P = (fu +1)(1-H) = (0.099 + 1)(1 - 0.45) = 0.6045, where fu is unbound plasma fraction (taken as 0.099 (15)) and H is hematocrit (taken as 0.45). ER was calculated as (CL/F)/((CL/F) + (QH)), where CL/F = oral clearance, QH = 25 mL/min/kg, assuming availability to the liver is unity and metabolism is complete (16). eAlprazolam dose = 1.0 mg (tablet) single-dose; keto dose = 200 mg po AM and PM x 5 doses. ER (observed) was calculated as described for triazolam using a B/P ratio of 0.7095, calculated from literature data (17), where fu = 0.29. An error is introduced, since ~ 20% of a dose is excreted intact in urine. When a drug has sufficient one-compartmental disposition, Ki may be calculated graphically during monoexponential decay after first-pass metabolism has ended. Consider the appropriate variant of Eq 5, posited below:
where V is volume of distribution. Rearrangement of Eq 6 yields:
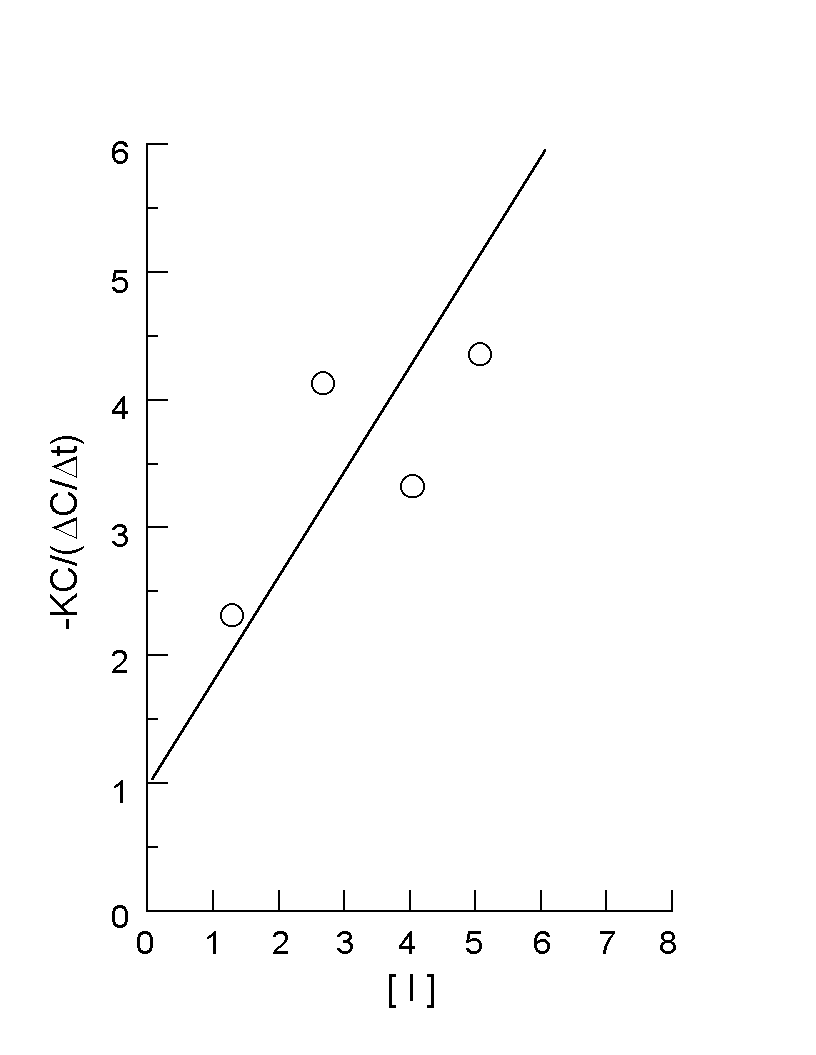
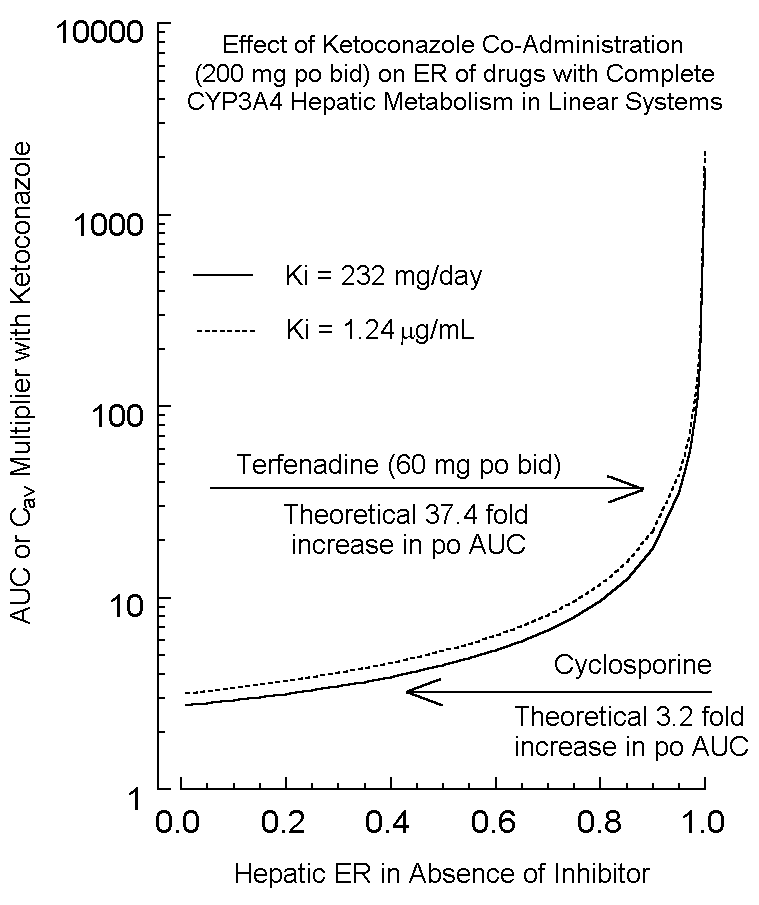
K is the disposition rate constant determined in the absence of inhibitor, and the left-hand side of the equation is plotted against (I), yielding a linear plot with (1/Ki) as slope and unity as the intercept. This approach was used to determine the ketoconazole Ki administered concomitantly with single-dose oral triazolam (14). Fig. 2 illustrates this plot, with Ki determined as 1.24 mg/mL. The average ketoconazole plasma concentration in this study was 2.66 mg/mL (steady-state AUC from mean profile divided by dosage interval of 12 hours). Consequently, the percent inhibition of triazolam metabolism (and, theoretically, any drug) at this mean ketoconazole concentration of 2.66 mg/mL is 68.21% (from Eq. 4). In their human work on ketoconazole inhibition of triazolam and alprazolam in vivo metabolism pharmacokinetics, Greenblatt et al (14) noted that ketoconazole exhibited a more profound increase in triazolam AUC relative to alprazolam (ERs of 0.296 and 0.0648, respectively; AUC increases of about 13.7 and 3.98 fold, respectively – see below). In evaluating the effect of competitive inhibition on bioavailability, one need only look at the term [(1-ER)/(ER)] from Eq 3, which is proportional to AUC(0 - ¥). The numerator reflects first-pass hepatic metabolism, and the denominator reflects systemic clearance. For high ER ratio drugs in particular, (1-ER) can profoundly be affected by drug metabolism inhibition. For example, in the case of terfenadine discussed previously, ER went from 95.27% in the absence of ketoconazole to 34.96% in the presence of ketoconazole. The ratio of (1-ER) terms is this example is (1-0.3496)/(1-0.9527), equal to 13.75. The ratio of (1/ER) values, reflecting the denominator contribution due to systemic clearance, is 2.725. Multiplying 13.75 by 2.725 gives the overall ratio of AUCs, approximately 37.4 fold. In this example, the first-pass effect accounts for a much more significant effect on AUC. As ER declines between drugs, first-pass effect will also decline in importance, as will the overall effect on AUC increase in the presence of an inhibitor. This is vividly illustrated in Fig 3 which illustrates the ratio of oral AUC in the presence to the absence of competitive inhibitor. Note that as ER increases, the effect of inhibitor can increase dramatically. Herein lies the danger of high extraction ratio drugs administered orally (assuming intact drug produces pharmacodynamic and/or toxic effects). When combined with inhibitors, one can increase AUC and Cav quite dramatically. This helps explain why co-administration of ketoconazole with terfenadine (calculated oral AUC ratio increase of 37.4 fold on a terfenadine po regimen of 60 mg Q 12 h and a ketoconazole po regimen of 200 mg Q 12 h) can produce terfenadine toxicity associated with QT interval prolongation, abnormal morphology of the TU complex, torsades de pointes, etc. (7). It also helps explain rhabdomyolysis induced by the addition of mibefradil (a potent CYP 3A4 inhibitor) to therapy with certain cholesterol-lowering "statins" or HMG CoA reductase inhibitors (e.g., lovastatin and simvastatin). Some "statins" are CYP 3A4 substrates with high ERs in some patients. The calcium channel blocker mibefradil, previously used in the US for treatment of hypertension and chronic stable angina, was voluntarily withdrawn from the US marketplace by its manufacturer due to its many drug interactions related to CYP 3A4 inhibition, including CYP 3A4 mediated metabolism of lovastatin and simvastatin (18). Figure 2. Plot of – KC (D C/D t) vs. [I], where: K is the triazolam disposition rate constant (0.260 h-1) determined from linear regression of terminal phase data points of the mean semilogarithmic plasma concentration-time profile (14); C is mean triazolam plasma concentration interpolated at the midpoint of data used for D t determinations and [I] (mg/mL) is interpolated mean ketoconazole plasma concentration at the same time as alprazolam. An outlier data point was omitted from the plot and analysis. The line, which was forced through a y-intercept of 1.0, was drawn by eye. Ki, the reciprocal of slope, is 1.24 mg/mL.As noted throughout, there are many assumptions inherent in the methods discussed in this paper. Additionally, drug metabolism inhibitors and other drugs may have other actions affecting oral bioavailability. For example, mibefradil not only inhibits CYP 3A4 but also inhibits the gut P-glycoprotein active transporter (19). Inhibition of this transporter by ketoconazole might also affect tacrolimus oral bioavailability (13). Figure 3. Theoretical increases in oral AUC or Cav for drugs completely metabolized by CYP 3A4 in the presence of concomitant ketoconazole. The solid line was calculated assuming Ki = 232 mg/day (calculated from terfenadine-ketoconazole studies; see text), whereas the dashed line used a concentration Ki of 1.24 mg/mL (calculated from a triazolam-ketoconazole study; see text and Fig. 2). Note the similarity of both curves. It was assumed ketoconazole, a competitive inhibitor of CYP 3A4, was dosed at 400 mg/day producing a constant amount of this inhibitor in the body (for Ki of 232 mg/day) or was present at a constant plasma concentration of 2.66 mg/mL (Cav from Greenblatt et al (14) during which ketoconazole was dosed at a rate of approximately 200 mg po Q 12 h for the triazolam interaction study). For the simulation, % inhibition was calculated from the middle term of Eq 4. For Ki = 232 mg/day, this was (100)(400 mg/day)/((400 mg/day) + (232 mg/day)), or 63.3%. To simulate data for the plot, the ER in the absence of ketoconazole was selected as the independent variable and the ER in the presence of ketoconazole was calculated from Eq 4. The ratio of AUCs was calculated as:
References
Corresponding Author: Harold Boxenbaum, Arishel Inc., 14621 Settlers Landing Way, North Potomac, Maryland, USA, email:shelbyb@ix.netcom.com Keywords: cytochrome P450, 3A4, ketoconazole, terfenadine, competitive inhibition Published by the Canadian Society for Pharmaceutical Sciences. Copyright © 1998 by the Canadian Society for Pharmaceutical Sciences. |
|||||||||||||||||||||||||||||||||||||||||||||


