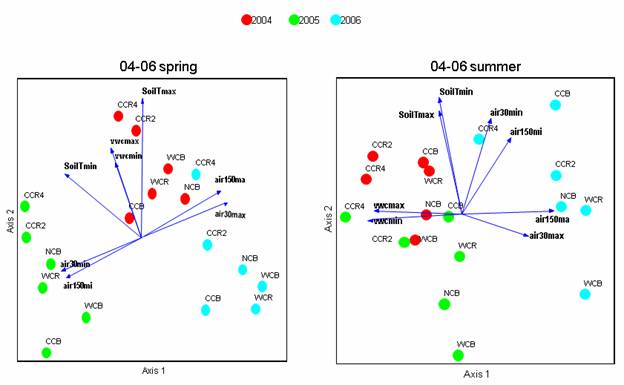
The figure below showed how the experimental plots allocated along with the environmental variables (each vector represent an environmental variable) in spring and summer 2004. Obviously, the pattern that the plots allocated in spring and summer is not the same. First, it showed that the environmental factors in different treatment are different. So the plots of the same treatment generally clustered together because of the treatment effect, it showed more obvious in summer than in spring, it indicated that the treatment had stronger effect in summer than in spring. For example the broadcast complete control plots (plot 11, 29 and 32) and the broadcast no control plots (plot 4, 33, and 35) are more clustered together in summer than in spring. Second, the change of the environmental variables is the result of both the seasonal changes and the modification of the interaction of the plants which reflect the different competition level because of the different treatment.
Some plots slightly changed such as plot 18 in terms of soil water content and soil temperature. On the other hand, some plots changed dramatically such as plot 33 which had very low minimum air temperature at 150cm above ground in spring, but had much higher air temperature at 150cm in summer. Plot 29 had low minimum soil temperature and air temperature at 30 cm above ground but these two factors are much higher in summer.
.jpg)
.jpg)
.jpg)
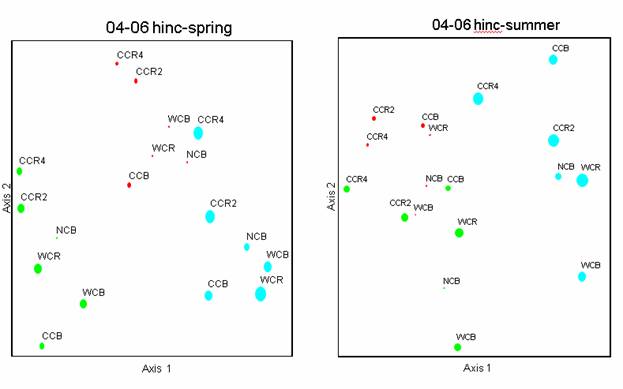
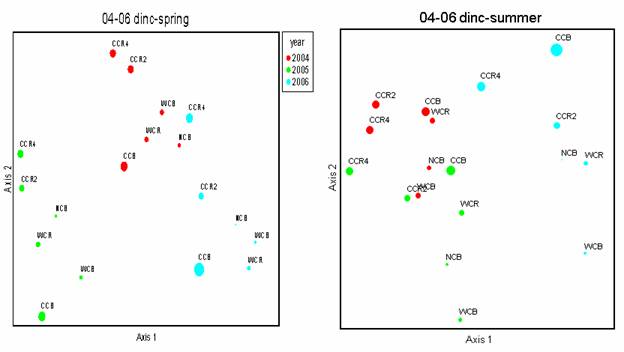
The relationship between height and diameter growth and the climate factors showed in the figure below. Compare with height and diameter growth, we can clearly see that some treatment favorite height growth such as broadcast woody control treatment (plot 10, 16 and 34) and broadcast no control treatment (plot 4, 33 and 35). Some treatment favorite both diameter and height growth such as broadcast complete control treatment (plot 11, 29 and 32)
.jpg)
.jpg)
.jpg)
The allocation of the treatment in spring and summer of 2005 and 2006 were showed in the figures below using the same method. The patterns between spring and summer are different of each year. Meanwhile, each year showed different pattern of the same season.
Obviously, the different treatment allocation along with the environmental factors changed every year. The seasonal patterns also different every year.
.jpg)
.jpg)
.jpg)
The tree growth of different treatment also changed each year. In 2004, the broadcast complete control treatment (CCB, plot 11, 29, 32) had more height growth than the radial woody control treatment (plot 5, 25, 38), however in 2006, the radial woody control treatment had more height growth than the CCB treatment. The 2 years radial complete control treatment (plot 7, 12, 13) also had more height growth than the CCB treatment which was less in 2004. But the CCB treatment had more diameter growth than the other treatments from 2004 to 2006. The broadcast no control treatment (NCB) had very limited diameter growth from 2004 to 2006.
The figure below showed how the treatment allocated along the environmental gradient in spring and summer from 2004 to 2006. Generally, the soil water content in spring 2004 is higher than in spring of 2005 and 2006. The minimum air temperature is higher in 2005 than in 2004 and 2006. In summer, the soil water content in 2004 and 2005 is higher than in 2006, but 2006 had higher air temperature and lower soil temperature than 2004 and 2005.


The height growth is 2006>2005>2004, but the diameter growth is very close in 2004, 2005 and 2006.
|

