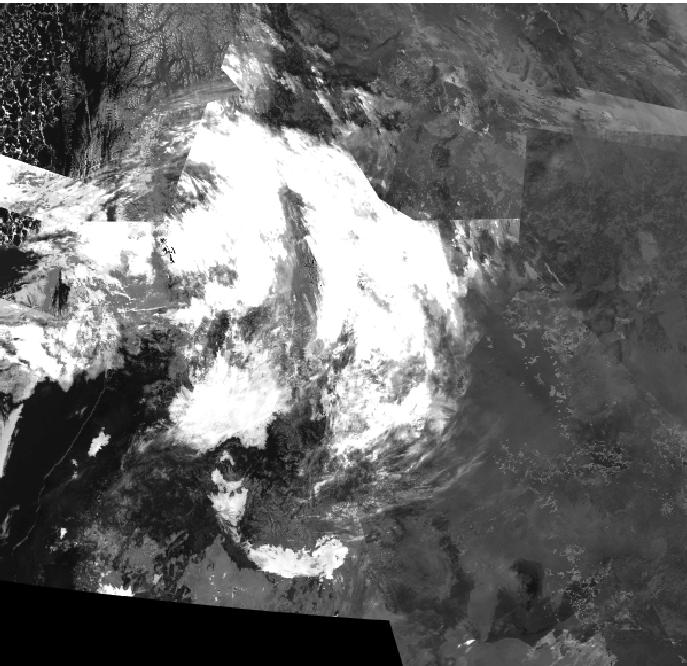
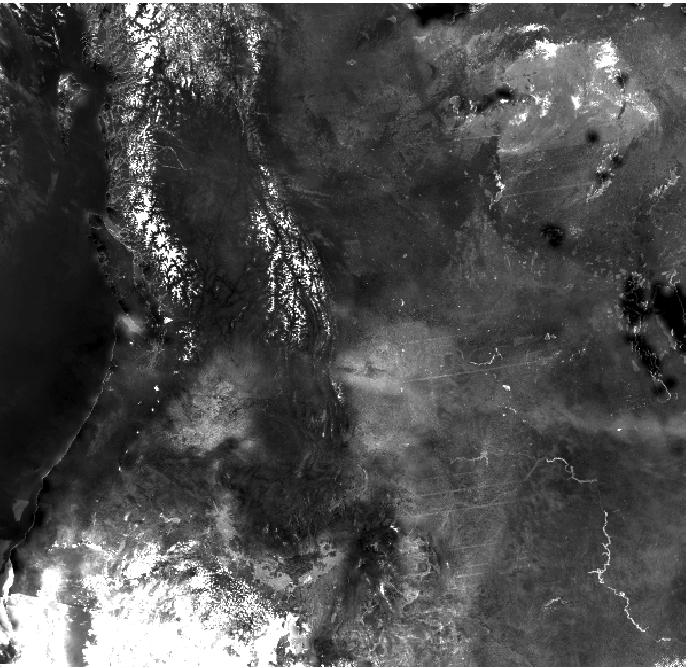
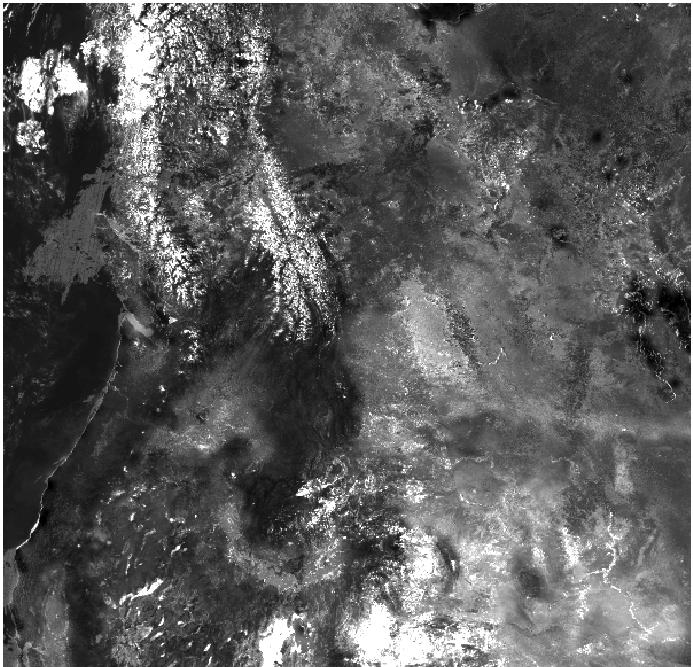
The satellite-derived vegetation properties used for this study were provided by normalized difference vegetation index (NDVI) [11,12].
NDVI is calculated by meteorological sensors such as the AVHRR (Advanced Very High Resolution Radiometer) embarked on the National Oceanic and Atmospheric Administration (NOAA) family of orbiting platforms. This data are particularly relevant to study climate change and forest productivity because of the comparatively long records of data already accumulated (1985-2005) [11, 12].
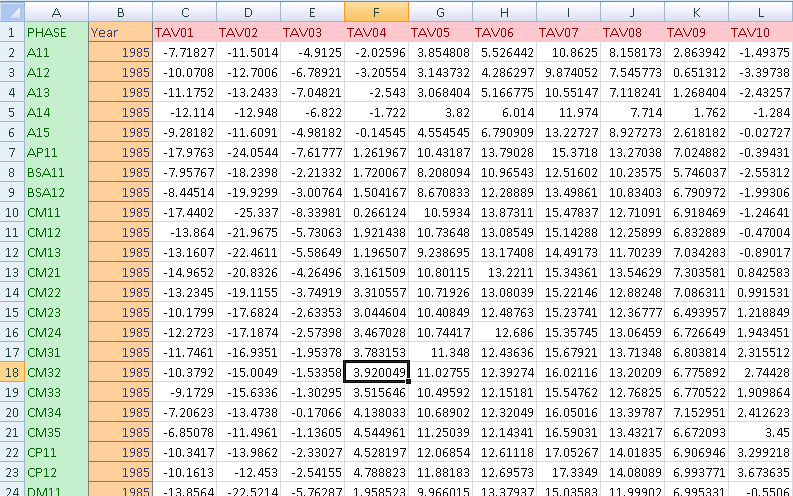
During preliminary analysis I refined NDVI values for BC and AB using SAS software version 9.1 (SAS Institute, Cary, NC), and ArcGIS v.9.2 (Environmental System Reasearch Institute, ESRI, Redlands, California). For each month there are 3 readings of NDVI and each reading has 2 extra files that specify the amount of clouds (CLOUDINDEX) and the quality of the data (QUALITYMASK). The NDVI values were averaged over a 3 month period similar to season length (i.e.: March-April-May, June-July-August).
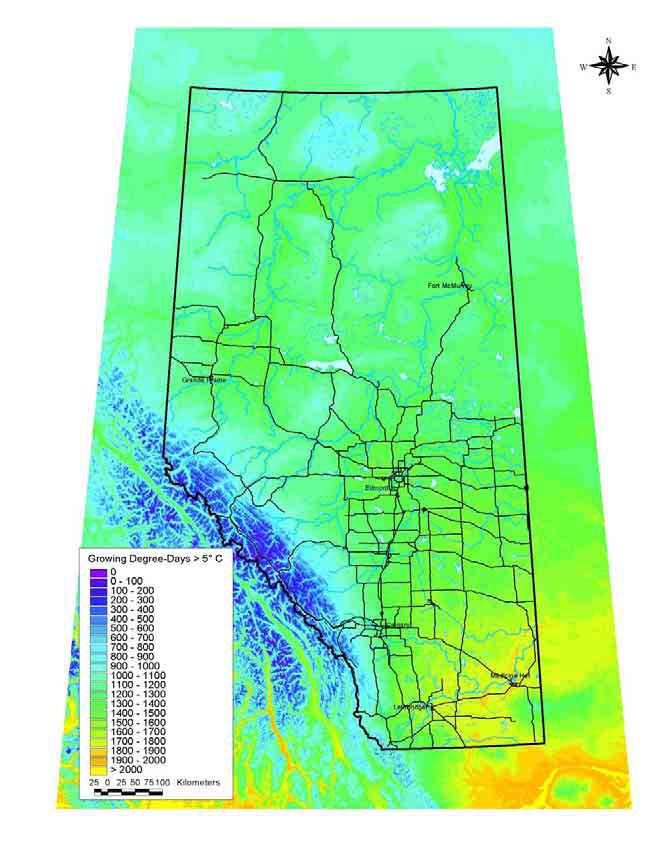
For the period 1985-2002, climate data, such as monthly average temperature, mean annual temperature (MAT), precipitation, degree-days above 5°C etc., were obtained from ClimateBC and ClimateAB programs [5-8]. During preliminary analysis using SAS and ArcGIS I calculated average values of the climatic data grouped by the ecosystems (zone level) for BC and AB. At the end of my preliminary analysis I could created a flat file of climate data parameters over a 20 year period for each ecosystem of BC and AB.
The NDVI data (averaged per season) were used in my model where climate data are the independent variable, in order to study the ecosystem productivity of BC and AB over the past 20 years.
To spatially predict ecosystem distribution over the past 2 decades, discriminant analysis were used to assign individual observations (tiles of multivariate climate data) to groups (ecosystems). For a selected group of 5 ecosystems the productivity was analyzed more in detail using regression models.
Overall, I investigated the geographic patterns of productivity differences that are expressed by NDVI which is likely to be correlated with the climatic descriptors of the year that can be generated with high resolution and accuracy for many climate variables [7].
My expectations were to prove whether or not primary productivity increased over the last 2 decades.
