Preliminary Screening
Principal component analysis is an useful tool to better understand the overall correlation and importance of each climatic parameter in relation to the Net Primary Productivity of the Eco-Zones of Alberta and British Columbia for the studied period.
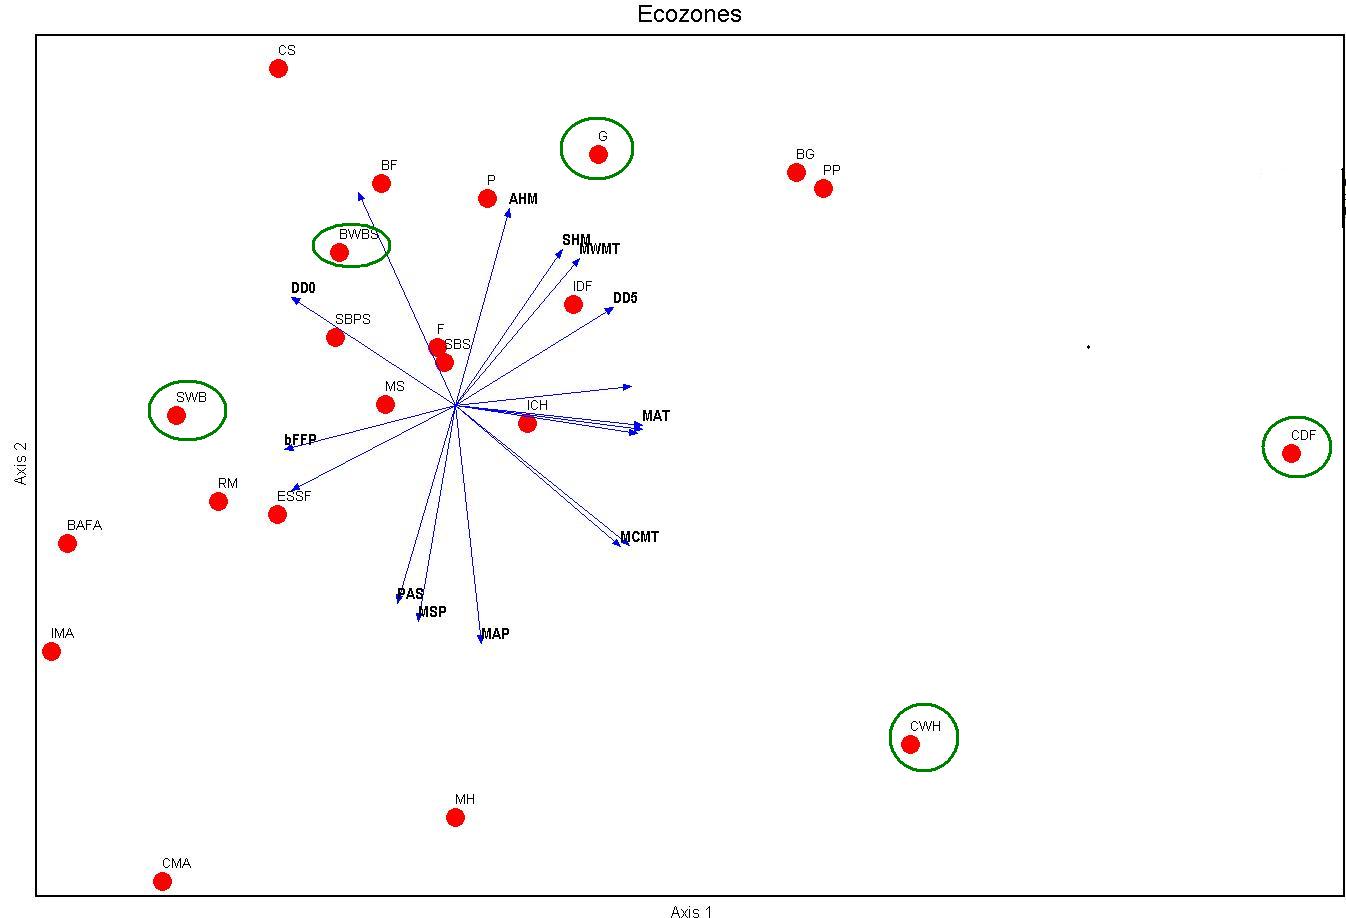
The graph below shows NDVI values averaged from 1986-2002 by the Eco-zones of AB and BC in relation to the climatic variables for the related period such as Mean Annual Temperature (MAT) and Mean Annual Precipitation (MAP) etc. The Principal Component analysis allowed me to calculate which climatic factors are the main drivers of each ecosystem variability. Starting from this analysis I could then more clearly visualize the differences among the ecosystems of AB and BC. Looking at the final graph I selected 5 ecosystems that would significantly represent the studied area. Click on the graph for a larger view.

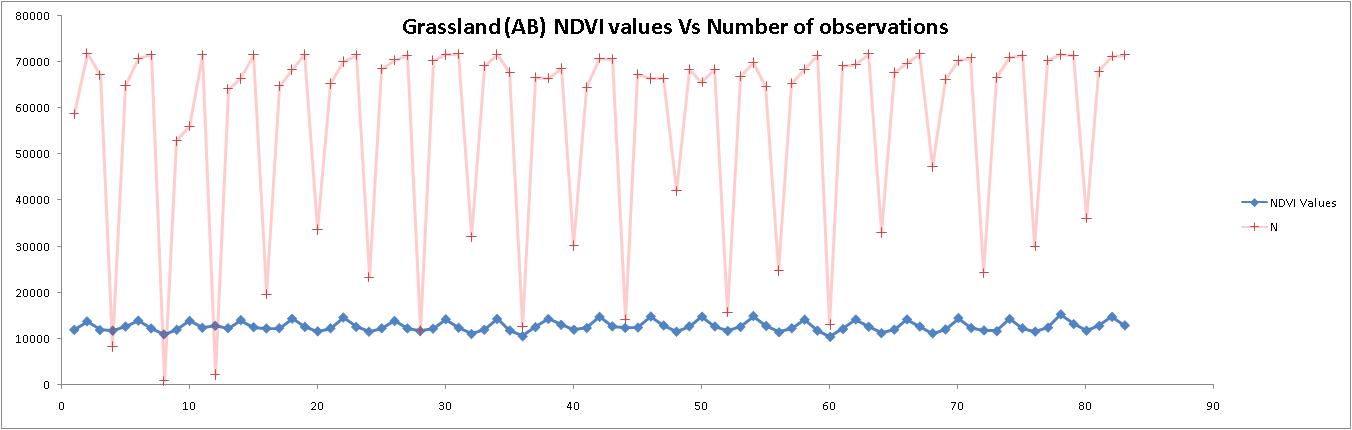
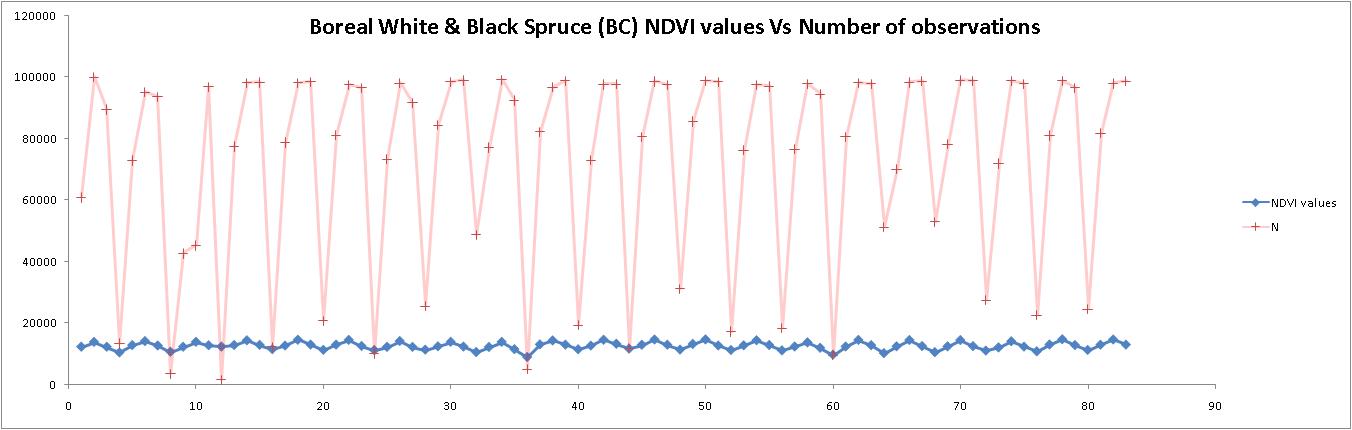
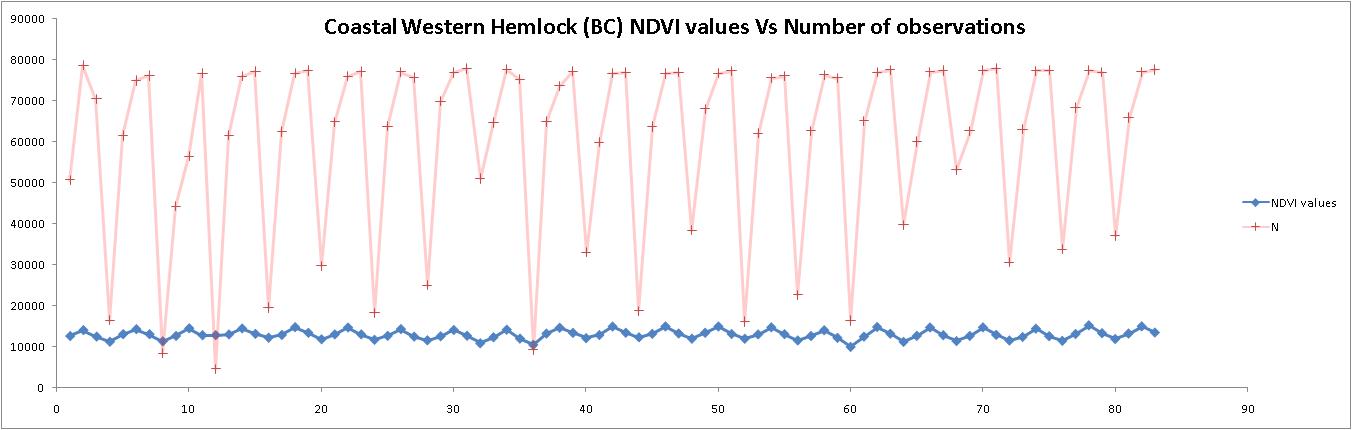
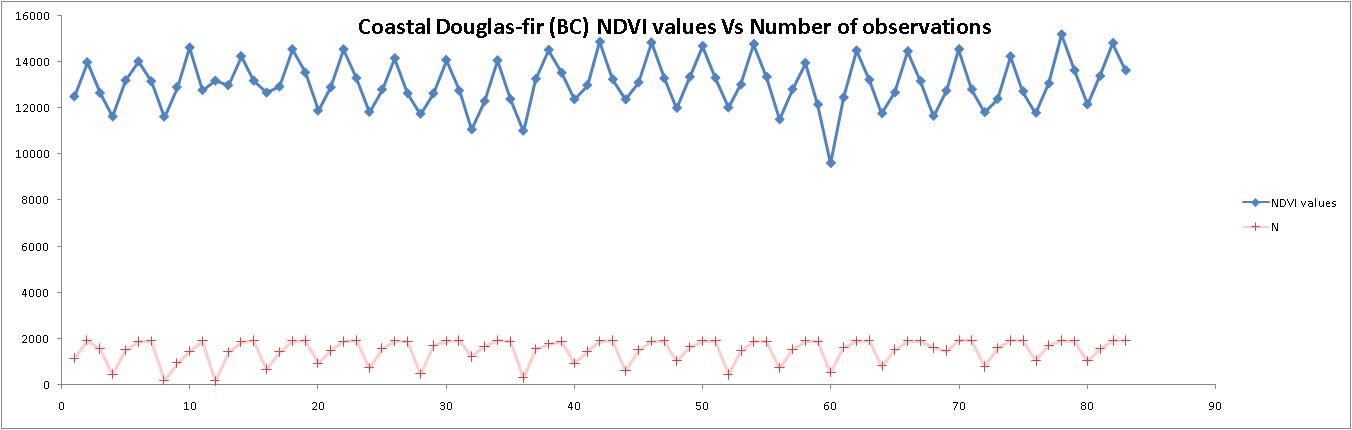
The selected zones went through a first screening to analyze more in depth the NDVI values in relation to the number of observations (N). In the attempt to exclude the possibility of a false outcome as a result of a strong correlation between the NDVI and N, I plotted the NDVI values over the studied period together with the number of observations. The results show no correlation implying that the data can now be statistically analyzed in more depth. For more details on this part of the statistical analysis click on the following ecosystems to visualize the related graph: Grassland, Spruce-Willow-Birch, Boreal White and Black Spruce,Coastal Western Hemlock, and Coastal Douglas-fir.
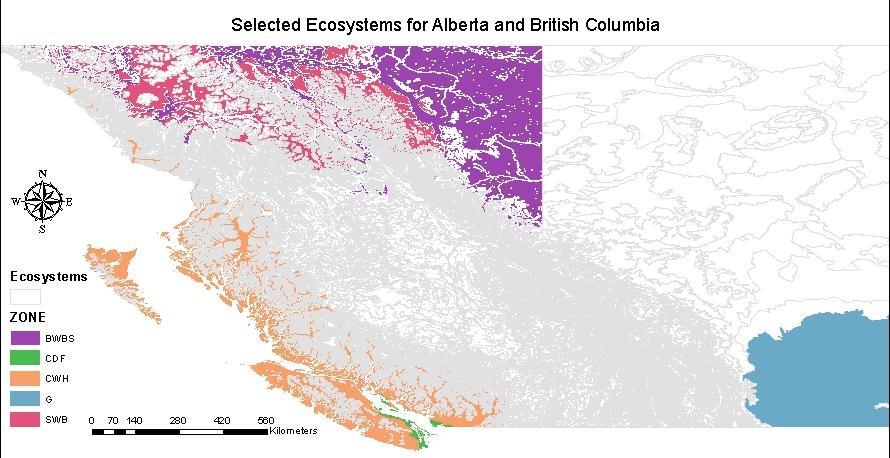
Selected Ecosystems
The graph below shows NDVI values for each summer over the studied period (1986-2002) for the Grassland zone of AB in relation to MAT and MAP. The size of the red circle reflects the NDVI parameter value and the length of the vectors represent the strength of the correlation. Since the Grassland is at the dry south end of Alberta, I expected that as the MAP precipitation increased the NDVI value increased but the overall wettest years (1992,1993 and 1996) did not show higher productivity values. The years with the highest productivity are located at mid-values of MAP and MAT indicating that once the ecosystem reaches a threshold level of temperature and precipitation productivity peeks and then declines as the previously mentioned climatic parameters increase. Click on the graph for a larger view.


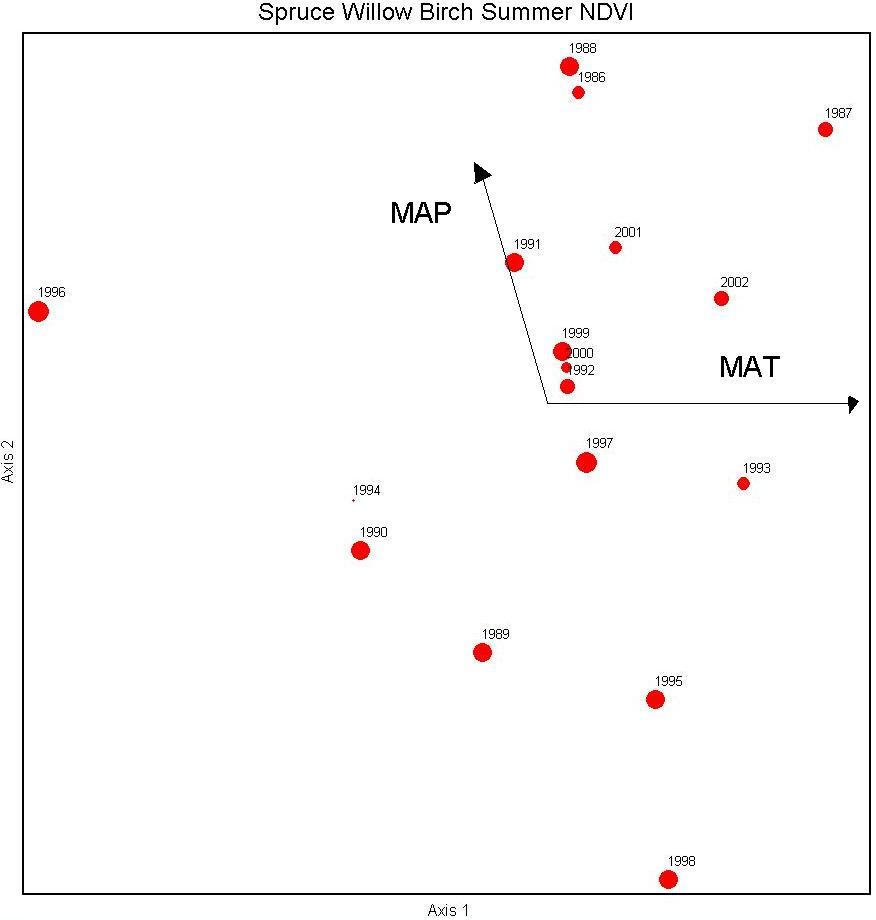
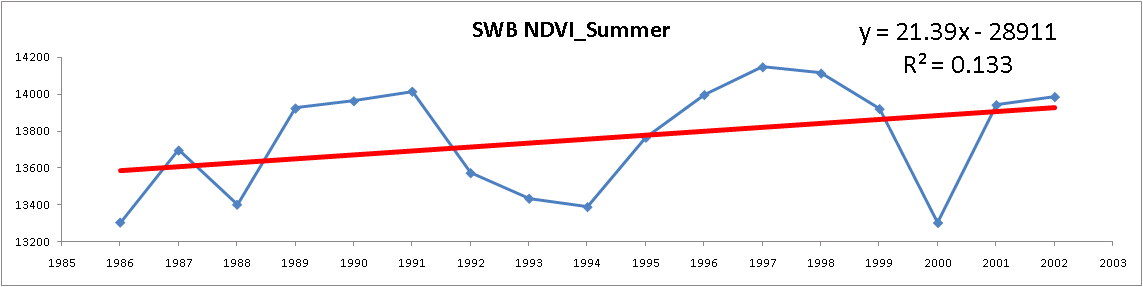
The graph below shows NDVI values for each summer over the studied period (1986-2002) for the Spruce-Willow-Birch (SWB) zone of BC in relation to MAT and MAP. The size of the red circle reflects the NDVI parameter value and the length of the vectors represent the strength of the correlation. This northern ecosystem might show limited summer productivity in relation to the temperature but the principal component analysis does not evidence a significant distribution pattern in relation to the climatic variables. MAT and MAP in this case don't seem to explain the difference in SWB productivity. Probably this ecosystem requires the exploration of other climatic variable but for consistency I didn't include more variables in this part of the project. Click on the graph for a larger view.
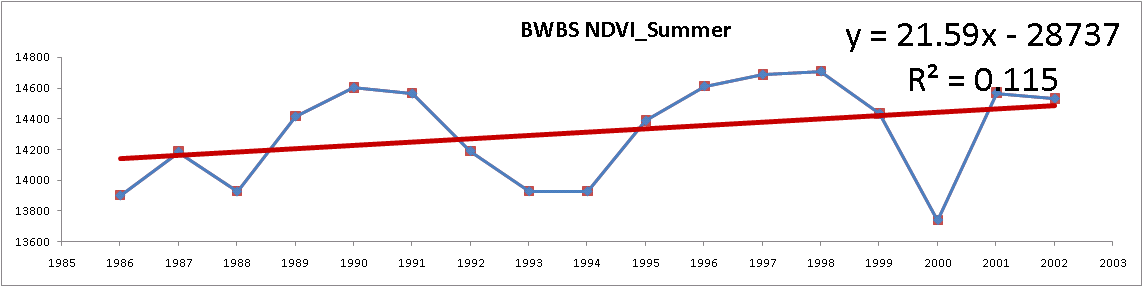
The graph below shows NDVI values for each summer over the studied period (1986-2002) for the Boreal White and Black Sruce (BWBS) zone of BC in relation to MAT and MAP. The size of the red circle reflects the NDVI parameter value and the length of the vectors represent the strength of the correlation. For this northern ecosystem of BC the analysis show quite clearly that annual precipitation is related to higher values of summer productivity. The graph nicely shows how the years with low productivity are located were MAP is lower. Click on the graph for a larger view.

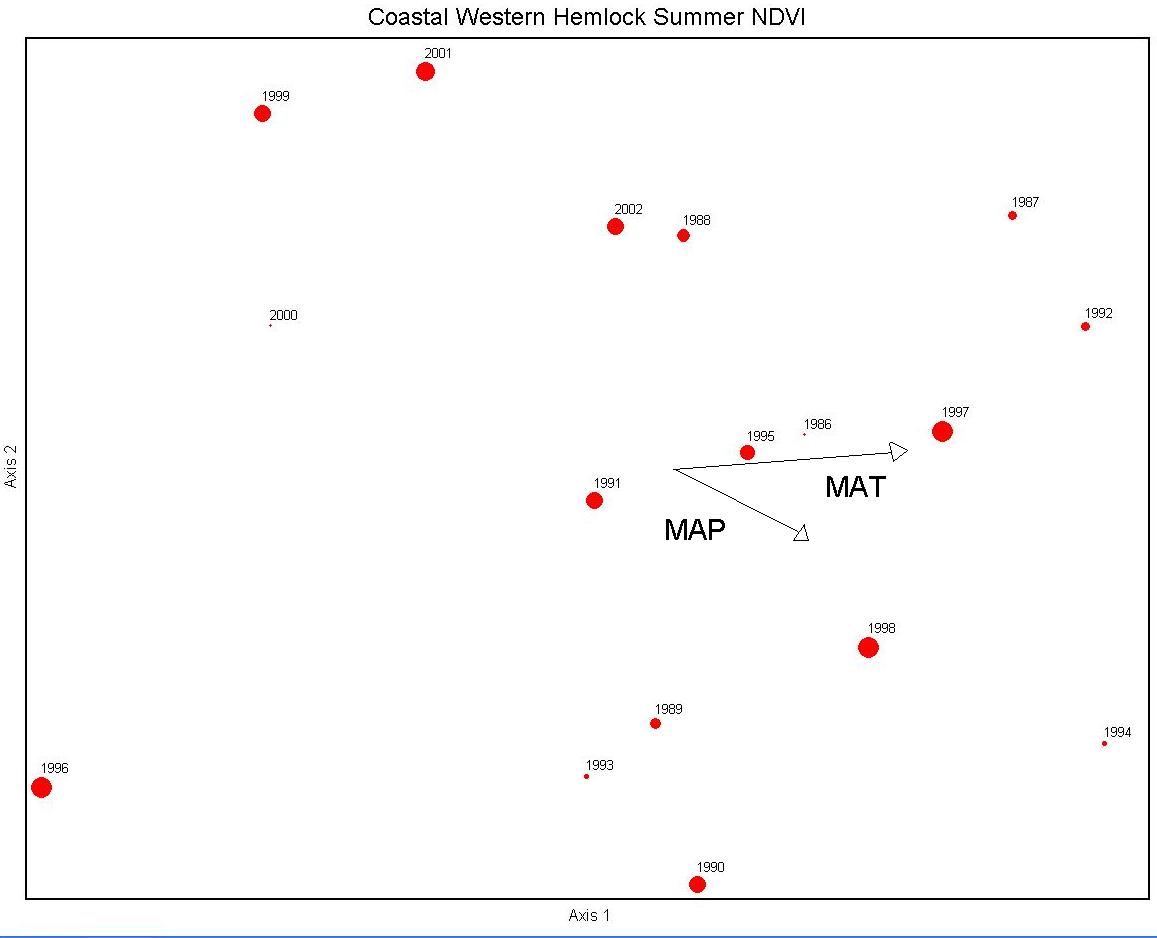
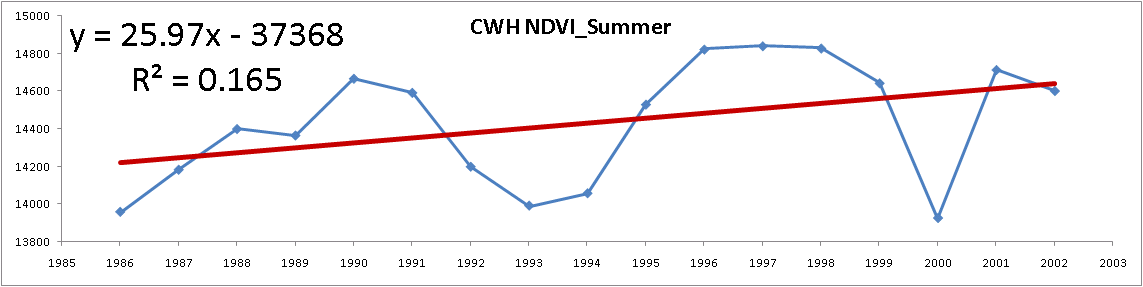
The graph below shows NDVI values for each summer over the studied period (1986-2002) for
the Coastal Western Hemlock (CWH)
zone of BC in relation to MAT and MAP. The size of the red circle
reflects the NDVI parameter value and the length of the vectors
represent the strength of the correlation. Also for this coastal
ecosystem of BC the distribution of the NDVI over the years doesn't
seem to be related to the values of MAP and MAT. Other climatic
parameters might capture more of the variability within the
summer NDVI values but for consistency were not included in this
project. Click on the graph for a larger view.
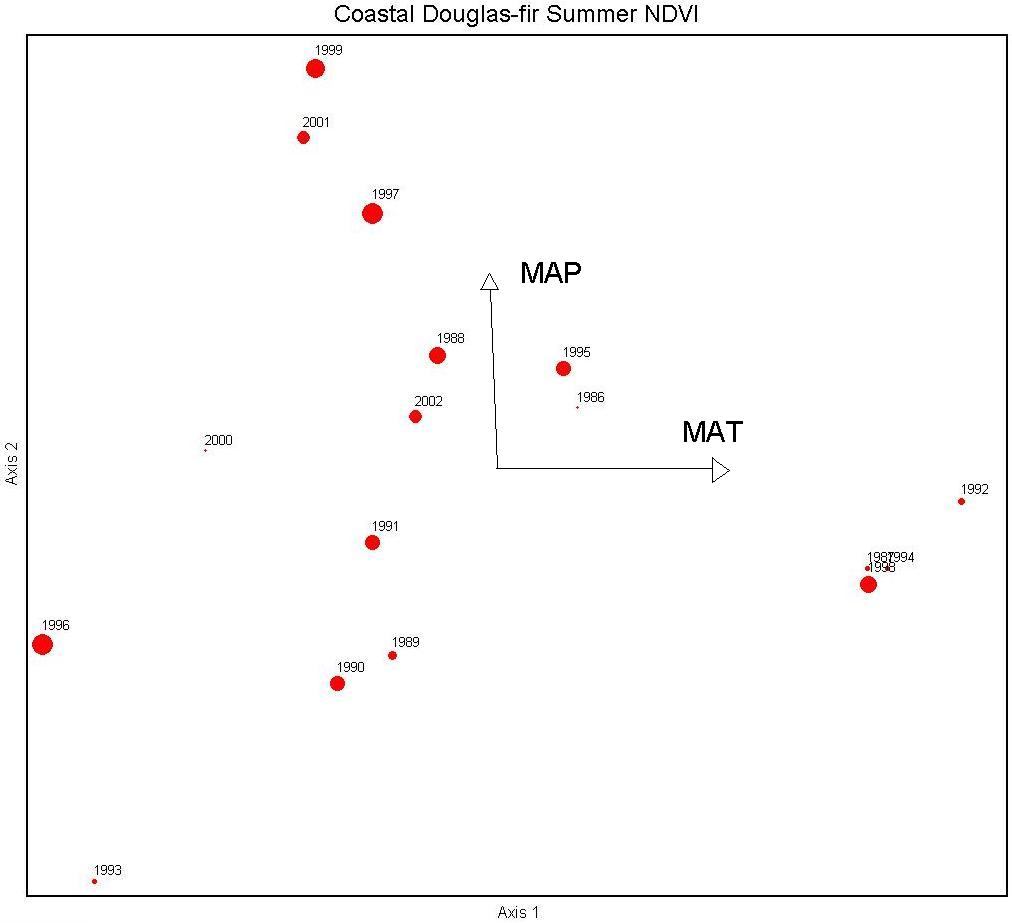
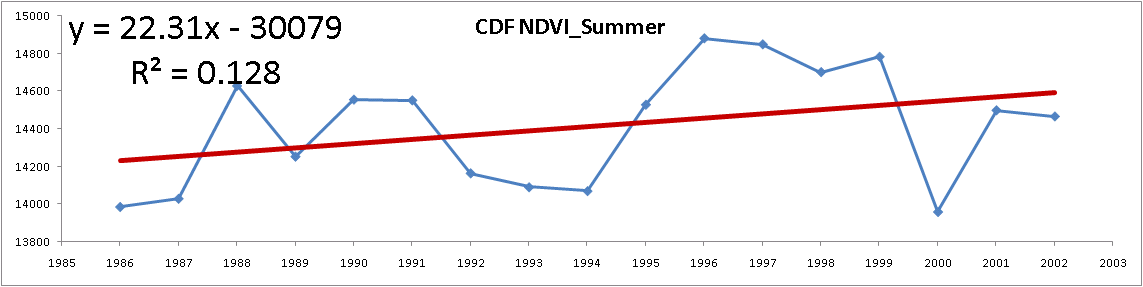
The graph below shows NDVI values for each summer over the studied period (1986-2002) for
the Coastal Douglas-fir (CDF)
zone of BC in relation to MAT and MAP. The size of the red circle
reflects the NDVI parameter value and the length of the vectors
represent the strength of the correlation. For this coastal ecosystem
of BC precipitation is not a limiting factor once the ecosystem reaches
its threshold value but the graph shows a higher concentration of
productive years when mean temperature are relatively lower. Probably
extremely high temperatures can reduce the ecosystem productivity. Click on the graph for a larger view.
Regression Final Analysis
In a more practical way, being the main goal to understand productivity (NPP) changes over time we can simply plot the NDVI values for each summer against time and fit the data with a linear model. For the 3 selected zones of AB and BC we observe that productivity increases slightly over time as shown in the 5 graphs below. Click on the graphs for a larger view.

