Past Climate
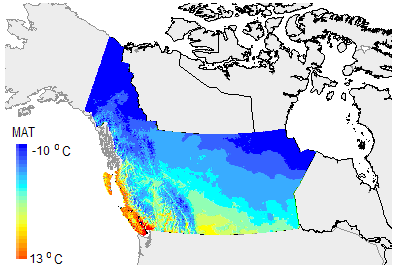
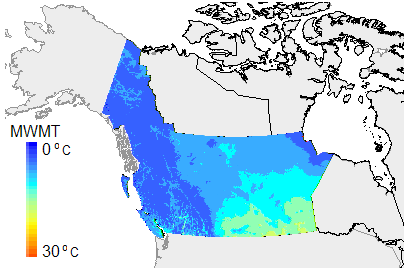
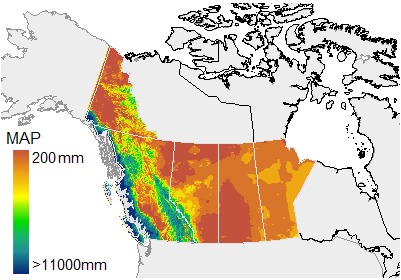
There has been a steady warming in western Canada over the last 100 years. Plots of climte deviations of the 1901-2002 period from the 1961-1990 normals for individual ecozones agree with general climate trends in the regions and are consistent climate descriptions for the ecozones. The early 1900s were cooler than the 1961-1990, and the 1990-2002 period warmer.
Present Climate
To give a more recent look at climate in western canada, the 1991-2002 was used. This period has been warmer and drier than the 1961-1990 period. More recent climate records for the 2003-2005 from the canadian meteorological service... A comparison of the 1995-1995 and 1996-2000 5-year periods with the 1961-1990 clmate normals for western Canada reveals that the 1991-1995 was 0.7 degree Celcius warmer than the 1961-1990 period whereas the 1996-2000 was 0.8 degree Celcius warmer. Precipitation reduced by 2% in 1991-1995 and 7% during the 1996-2000 period.
Future Climate
Mean annual temperature has been projected to increase to about 4.2 degree Celcius by the 2080s, whereas mean annual precipitation is projected to increase by 8%. There will be a increase in warmest and well as coldest month temperatures as well as an in crease in the frost free period in the region. The table below shows projected change in climate variables from 1961-1990 normals to the 2080s. Visualisation of changes from 1901-1931 through the present (1961-1991) to the future are provided on the right.
Climate Variable |
Ref. period
1961-1990 |
Predicted Change |
2020s |
2050s |
2080s |
Mean Annual Temperature (oC) |
0.6 |
+0.2 |
+2.3 |
+3.7 |
Mean Warmest Month Temperature(oC) |
14.7 |
+1.2 |
+2.6 |
+4.3 |
Mean Coldest Month Temperature (oC) |
-17.4 |
+1.9 |
-4.0 |
+6.7 |
Temperature Difference (oC) |
32.2 |
-0.8 |
-1.5 |
-3.5 |
Mean annual precipitation (mm/%) |
696 |
+2 |
+5 |
+8 |
Mean summer precipitation (mm/%) |
334 |
+0.6 |
+1 |
+2 |
Precipitation as snow (mm/%) |
257 |
-4 |
-10 |
-19 |
Annual Heat moisture index |
17.9 |
+2.5 |
+5 |
+8.5 |
Summer heat moisture index |
50 |
+3.7 |
+7.7 |
+13.4 |
Number of forest free days |
142 |
+14 |
+29 |
+50 |
Frost free period |
78 |
+16 |
33 |
+54 |
Extreme coldest temperature (oC) |
-47 |
+2.3 |
+3.8 |
+6.3 |
Degree days below 0oC |
2259 |
-277 |
-562 |
-928 |
Degree days above 5oC |
1072 |
+210 |
+455 |
+822 |
Date when Degree days >5oC reaches 100 (Approximate date of bud burst) |
147 |
-9 |
-18 |
-28 |
|


