 -Young Growth Stand (PLOTA)
The data for this project was collected by a team including Andreas Hamman. Additional information about the species included in this project can be viewed at http://www.pbase.com/anhamann/guide
Data: Description of Data & Data CollectionFor this project 3 plots were analyzed: a Young Growth Stand (PlotA), a Mid Growth Stand (PlotB) and an Old Growth Stand (PlotC). During the data collection each of the research plots was segmented into 5mx5m subplots and each individual specimen in the subplot was recorded along with its dbh and its determined species.
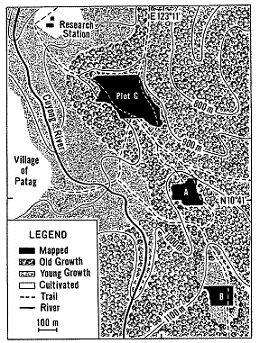
 FIGURE 2 illustrates the locations of the plots in relationship to one another. Select the map for a larger image.
Select the following stand maps for a larger views of the images.
Plot A is a diverse young growth forest stand (approximately 25 years of age as of 1995). It is located between the other 2 research plots and ranges between 1000m and 1030m above sea level. The plot has an irregular shape with a width of 140m and a length 145m at it's widest point. There are 93 different species present in the plot with a total of 1368 individual specimens.
Plot B is a diverse mid-age growth forest stand (approximately 50 years of age as of 1995). It is the southern most research plot and ranges between 1120m and 1150m above sea level. The plot has a regular shape except the lower left corner of the rectangle is missing. The plot has a width of 185m and a length of 115m at its widest points. There are 82 different species present in the plot with a total 1366 individual specimens.
Plot C is a highly diverse old growth forest stand (over 100 years old). It is the northern most research plot and ranges between 900m and 950m above sea level. The shape of the plot is irregular and the plot is significantly larger then the other 2 research plots. The plot has a width of 410m and a length of 225m at its widest points. As expected it has the greatest amount of biodiversity with 127 species and 3096 individual specimens.
The initial data collected for this project was very simplistic, but human error could have occurred when the data was collected. Misidentifying a species or mistakenly measuring the dbh could have a large impact on the results of the multivariate analyses. The simplest way to account for these possible error was to set conditions for the species to be included in the analysis. Variables were not calculated for species with less then 5 individuals in the stand since it would be an unreliable statistic. Species with low frequency in a stand were dropped, therefore eliminating possible misidentification. If a specimen was misidentified and identified as a species that had a highly frequent in the stand then unfortunately that error would be undetectable.
Clustering and dbh variables were calculated from the original data and used in the multivariate analyses. The methods that were used to calculated and select the variables can be viewed on the Data Preparation Methods and Data Preparation Results & Discussion links at the bottom of the page. Select the Data Table to view the data table used in the multivariate analyses.
HOME
INTRODUCTION
DATA DETAILS
MULTIVARIATE METHODS
MULTIVARIATE RESULTS & DISCUSSION
CONCLUSION
APPENDICES
REFERENCES & ACKNOWLEDGEMENTS
DATA PREPARATION METHODS
DATA PREPARATION RESULTS & DISCUSSION
PRELIMINARY ANALYSIS