Kauro Ishikawa. 1982. Guide to
Quality Control: 18-29
Yonatan Reshef
School of Business
University of Alberta
Edmonton, Alberta
T6G 2R6 CANADA
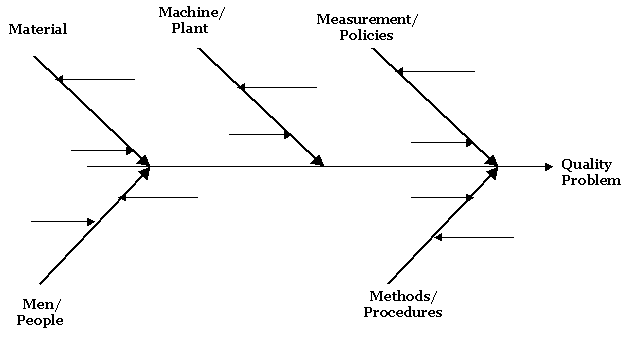
Cause-and-effect diagrams were developed by Kauro Ishikawa of Tokyo University in 1943 and thus are often called Ishikawa Diagrams. They are also known as fishbone diagrams because of their appearance (in the plotted form). Cause-and-effect diagrams are used to systematically list the different causes that can be attributed to a problem (or an effect). A cause-and-effect diagram can aid in identifying the reasons why a process goes out of control. As such, they should be part of the PLAN stage of the PDCA CIRCLE.
There are three main applications of cause-and-effect diagrams:
1. Cause enumeration
is one of the most widely used
graphical techniques for quality control and improvement.
Sometime it may be very difficult to determine the primary causes to
be included in the diagram. If that is the case, after we have
determined the characteristic or effect we are examining, we follow
these steps:
• Use brainstorming to create a list of all the possible causes. The
list will contain a mixture of primary, secondary and tertiary (or
big bone, middle sized bone and small bone) causes.
• Sort the list by grouping causes that are related.
• Identify or name each major grouping and make your
cause-and-effect diagram. Thus cause
enumeration facilitates the identification of root causes because all conceivable causes
are listed.
• Machine, Manpower, Material, Measurement, Method and Environment
are frequently used major causes that can apply to many processes.
2. In Dispersion analysis, each major cause is thoroughly analyzed by investigating the sub-causes and their impact on the quality characteristics (or effect) in question. The key to this diagram's effectiveness lies in the reiteration of the question, "Why does this dispersion occur?" This diagram helps us analyze the the reasons for any variability, or dispersion. Unlike cause enumeration where smaller causes that are considered insignificant are still listed, in dispersion analysis, causes that don't fit the selected categories are not listed. In other words, the weak point is that the form the diagram takes often depends on the individuals making it, and that sometimes small causes are not isolated or observed. Consequently, it is possible that some root causes will not be identified in dispersion analysis.
3. When cause-and-effect diagrams are constructed for process analysis, the emphasis is on listing the causes in the sequence in which the operations are actually conducted. The advantage of this diagram is that, since it follows the sequence of the production process, it is easy to assemble and understand. The disadvantage is that similar causes appear again and again, and causes due to a combination of more than one factor are difficult to illustrate.

CREATING A FISHBONE DIAGRAM
Cause Enumeration
![]() Identify a quality
problem
Identify a quality
problem
![]() Generate causes
Generate causes
![]() Structured brainstorming (Round Robin; 6-3-5; etc.)
Structured brainstorming (Round Robin; 6-3-5; etc.)
![]() Construct the fishbone Diagram
Construct the fishbone Diagram
Some of my thoughts on the fishbone diagram technique
![]() The final
diagram does not rank causes according to their importance. In other
words, the diagram
does not identify leverage points; that is points the manipulation of which will
significantly improve the quality of the process at hand.
The final
diagram does not rank causes according to their importance. In other
words, the diagram
does not identify leverage points; that is points the manipulation of which will
significantly improve the quality of the process at hand.
![]() The diagram is a very attractive
tool. On the face of it, it is easy to learn and apply. However, it is a mistake to
approach it without mastering at least some organizational learning skills, such as
working together with others, seeking the truth, being open to different
ideas, see others who might oppose you as colleagues with different
ideas. Without
such skills, internal politics can dominate the process (e.g., team members bring to the diagram construction process a political
agenda and in the end, the most powerful opinion [paradigm] dominates).
The diagram is a very attractive
tool. On the face of it, it is easy to learn and apply. However, it is a mistake to
approach it without mastering at least some organizational learning skills, such as
working together with others, seeking the truth, being open to different
ideas, see others who might oppose you as colleagues with different
ideas. Without
such skills, internal politics can dominate the process (e.g., team members bring to the diagram construction process a political
agenda and in the end, the most powerful opinion [paradigm] dominates).
![]() Some secondary causes may fit with
more than a single root cause. Some secondary causes may not fit
with any root causes.
Some secondary causes may fit with
more than a single root cause. Some secondary causes may not fit
with any root causes.
![]() When should we stop adding causes to the diagram? When
we do not have any authority to address these causes.
When should we stop adding causes to the diagram? When
we do not have any authority to address these causes.