CREATING A FISHBONE DIAGRAM
Cause Enumeration/Dispersion Analysis
Kauro Ishikawa. 1982. Guide to
Quality Control: 18-29
Yonatan Reshef
School of Business
University of Alberta
Edmonton, Alberta
T6G 2R6 CANADA
![]() Define the problem
Define the problem
|
Low course evaluations |
![]() Collect information
from students - 15 minutes
Collect information
from students - 15 minutes
Use tools such as check sheets or brainstorming. If check sheets are used,
each cause should be totalled across 13/26/39 class meetings. If brainstorming is used,
decide on the technique:
- Structured brainstorming (Round Robin; 6-3-5 [6 people - 5 minutes - 3 ideas]; etc.)
- Ask: Why does it happen?
![]() Arrange the causes
Arrange the causes
Write causes on sticky notes.
Place the causes generated through the former step on a flip chart so that all
the students can clearly see them. Place the sheets on the wall.
![]() Collect information from
professors - 15
minutes
Collect information from
professors - 15
minutes
Get more information from a different source, professors. Now, place the
new set of causes on a flip chart so that all the students can clearly see them.
Place the sheets on the wall.
![]() Decide
on the root causes - 10 minutes
Decide
on the root causes - 10 minutes
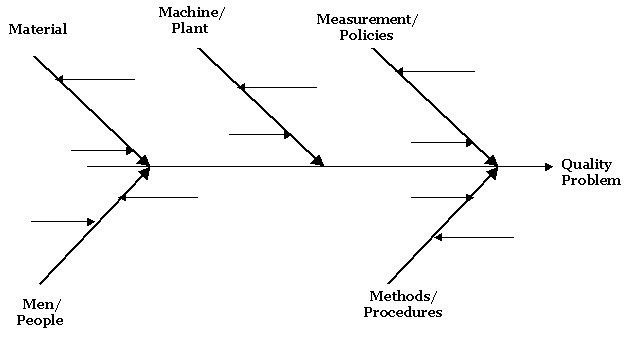
Use check
sheets, Pareto charts, and brainstorming to identify root causes (e.g. material, machine, measurement,
methods, men) and agree on secondary causes
![]() Construct
your diagram with the root causes
Construct
your diagram with the root causes
![]() Review - 5
minutes
Review - 5
minutes
![]() Construct
the rest of the diagram - 15 minutes
Construct
the rest of the diagram - 15 minutes
Attach the secondary causes to their respective root causes
![]() Review - 15
minutes
Review - 15
minutes
If time
permits
![]() Prioritize root/secondary causes using
the Nominal Group Technique, which allows a team to quickly come to a consensus
on the relative importance of issues by integrating individual importance
rankings into a team final priorities.
Prioritize root/secondary causes using
the Nominal Group Technique, which allows a team to quickly come to a consensus
on the relative importance of issues by integrating individual importance
rankings into a team final priorities.
STEP 1 - The Team Attaches a Letter to Each Major Cause
A Professor
B Students
C Facility
D Technology
STEP 2 - Each Team
Member Prioritizes
the Major Causes
A 3
B 4
C 2
D 1
Here, "4" is the most important and "1" is the least important ranking .
STEP 3
Summarize points across all the team member rankings
![]() Prepare an action plan for improvement.
Prepare an action plan for improvement.