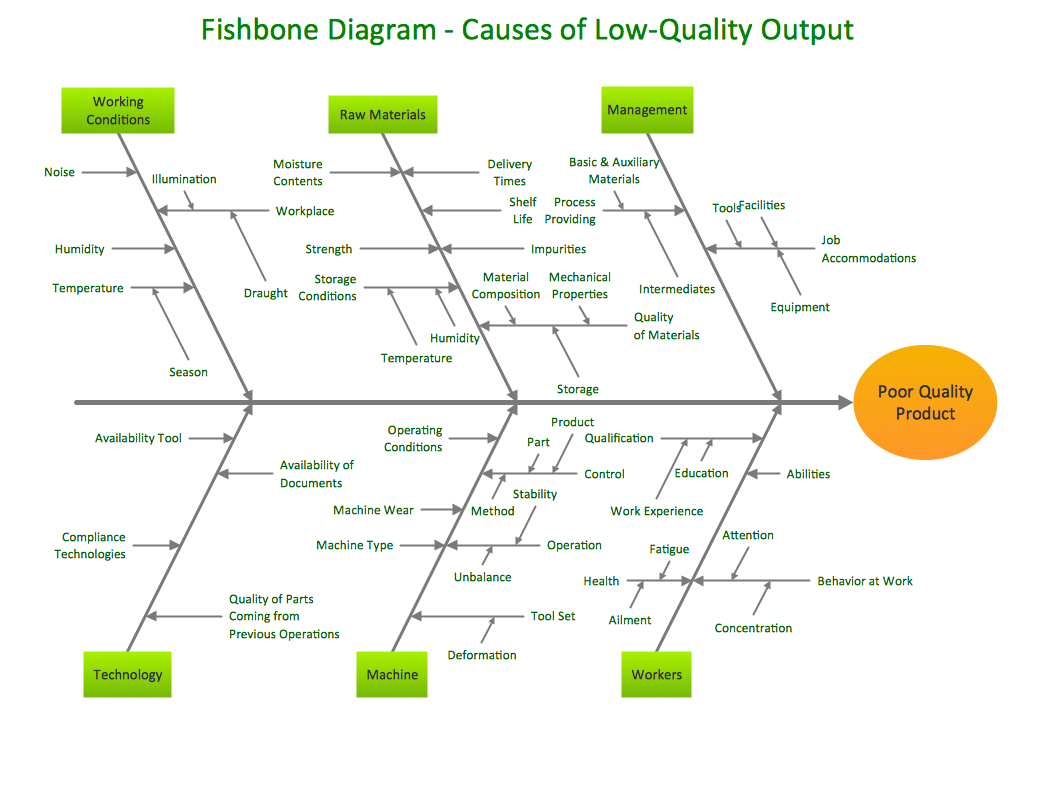
DISPERSION ANALYSIS
STEP 1
Write down the effect to be investigated and draw the "backbone" arrow
to it. In our example the effect is "low teaching evaluations."
STEP 2
Identify all the
broad areas, that is root causes, of enquiry in which the causes of the
effect being onvestigated may lie -- skills, communication, experience,
gender, recruiting, technology, environment, students, etc. The root
causes are the underlying processes and system
properties that allowed the contributing factors to culimnate in a
harmful event.
STEP 3
This step requires the greatest amount of work and imagination because
it requires you and your team to write all the detailed possible causes
in each of the broad areas (i.e., root cuases) of enquiry. Each
cause identified should be fully explored for further, more specific
causes which, in turn, contribute to them. For each cause you ask,
"Why does this dispersion (cause) occur?" This diagram helps us outlining the reasons for any variability,
or dispersion. Unlike cause enumeration (see below) where smaller causes that
are considered insignificant are still listed, in dispersion
analysis, causes that don't fit the selected major causes are not
listed. In other words, sometimes small causes are not isolated or
observed. Consequently, it is possible that some root causes
will not be identified in dispersion analysis.
CAUSE ENUMERATION
This
is not so much a different type of diagram but a different method of
constructing a diagram. Instead of building up a chart gradually
(starting with the "backbone," deciding on root causes, then adding
more and more branches), you postpone drawing the chart and simply list
all the possible causes first. Then draw the chart in ordr to
relate the causes to each other. This method has the advantage
that the list of possible causes will be more comprehensive because the
process has a more free-form nature. The disadvantage is that it
is more difficult to draw the diagram from this list rather than from
scratch.
Sometime it may be very difficult to determine the root causes to
be included in the diagram. If that is the case, after we have
determined the characteristic or effect we are examining, we follow
these steps:
• Use brainstorming to create a list of all the possible causes. The
list will contain a mixture of primary, secondary and tertiary (or root causes, middle sized bones and small bones) causes.
• Sort the list by grouping causes that are related.
• Identify or name each major grouping and make your
cause-and-effect diagram. (Thus cause
enumeration facilitates the identification of root causes because all conceivable causes
are listed.)
• Machine, Manpower, Material, Measurement, Method and Environment
are frequently used major causes that can apply to many processes.
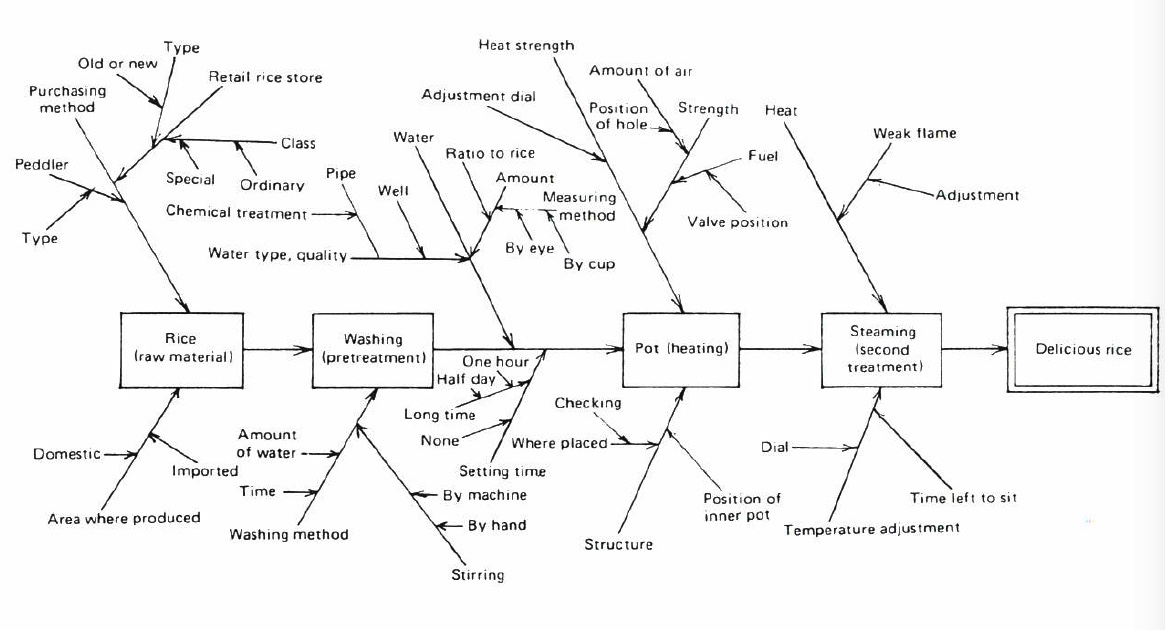
PRODUCTION or PROCESS CALSSIFICATION TYPE
When cause-and-effect diagrams are constructed for
process
analysis, the emphasis is on listing along the "backbone" of the diagram the causes in the
sequence in which the
operations are actually conducted. The advantage of this diagram is that, since it follows
the sequence of the production process, it is easy to assemble and understand. The
disadvantage is that similar causes may appear again and again, and causes due to a
combination of more than one factor are difficult to illustrate.
The following diagram is taken from: Kauro Ishikawa. 1982. Guide to Quality Control. Asian Productivity Organzization: 150.
 The final
diagram does not rank causes according to their importance. In other
words, the diagram
does not identify leverage points; that is points the manipulation of which will
significantly improve the quality of the process at hand.
The final
diagram does not rank causes according to their importance. In other
words, the diagram
does not identify leverage points; that is points the manipulation of which will
significantly improve the quality of the process at hand.
The diagram is a very attractive tool. Seemingly, it is easy to
learn and apply. However, it is a mistake to approach it without
mastering at least some "soft" skills, such as working together with others,
seeking the truth, being open to different ideas, seeing others who
might oppose you as colleagues with different ideas. Without such
skills, internal politics may dominate the process
(e.g., team members bring to the diagram construction process a
political agenda and in the end, the most powerful opinion [paradigm] dominates).
Some secondary causes may fit with
more than a single root cause. Some secondary causes may not fit
with any root causes.
When should we stop adding causes to the diagram? When
we do not have any authority to address these causes.