|
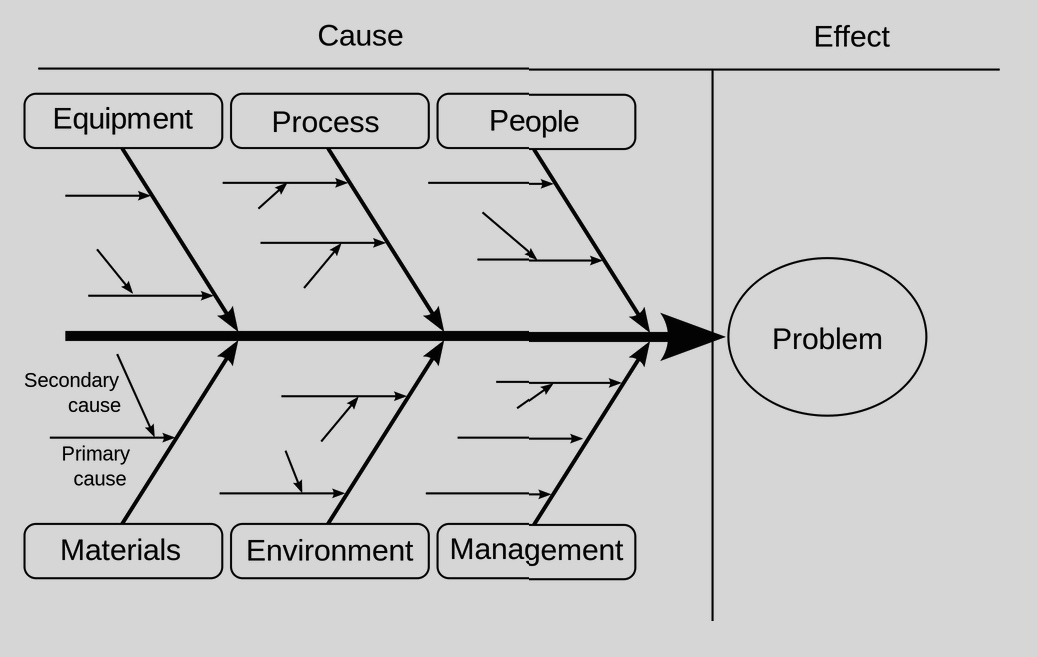
CREATING A FISHBONE DIAGRAM
Cause Enumeration
Kauro Ishikawa. 1982. Guide to
Quality Control: 18-29
Yonatan Reshef
School of Business
University of Alberta
Edmonton, Alberta
T6G 2R6 CANADA
 Define the problem (which is a discrepancy between current and desired performance)
Collect information
from students - 15 minutes
Use tools such as check sheets or brainstorming. If check sheets are used,
each cause should be totaled across 13/26/39 class meetings. If brainstorming is used,
decide on the technique:
- Unstructured
brainstorming-
Structured brainstorming (Round Robin; 6-3-5 [6 people - 5 minutes -
3 ideas]; rotate 6 times)
- Ask: Why does it
happen?
Arrange the causes
Write causes on
sticky notes. Place the causes
generated through the former step on a flip chart so that all the students can
clearly see them. Tape the sheets to the wall.
Collect information from
professors - 15
minutes
Get more information from a different source, professors. Now, place the
new set of causes on a flip chart so that all the students can clearly see them.
Place the sheets on the wall.
Decide
on the root causes - 10 minutes
Use check
sheets, Pareto charts, and brainstorming to identify root (main) causes. Here are a few templates:
4 M's of manfacturing - Machine, Method, Manpower, Material
4 S's of the service sector - Surroundings, Suppliers, Systems, Skills
5 M's - Measurement, Maintenance, Money, Management, Mother Nature
8 P's - Product, Price, Place, Promotion, People, Process, Physical Environment, Productivity
The root
causes of the problem are the underlying processes and system
properties that allowed the contributing factors to culimnate in a
harmful event. To help indetify the root causes from all the
ideas generated, consider a multi-voting technique such as having each
team member identify the top three root causes. Once you have
identified root causes and contributing factors, you will need to
address each root cause and cntributing factor as appropriate.
Construct
your diagram with the root causes
Review - 5
minutes Construct
the rest of the diagram - 15 minutes
Attach the primary and secondary causes to their respective root causes
Review - 15
minutes If time
permits
Prioritize root/primary causes using
the Nominal Group Technique, which allows a team to quickly come to a consensus
on the relative importance of issues by integrating individual importance
rankings into a team final priorities.
STEP 1 - The Team Attaches a letter to Each Major Cause
A Professor
B Students
C Facility
D Technology STEP 2 - Each Team
Member Ranks the Major Causes
A 3
B 4
C 2
D 1 Here, "4" is the most important and
"1" is the least important ranking .
STEP 3
Summarize points across all the team member rankings
Prepare an action plan for improvement.
|