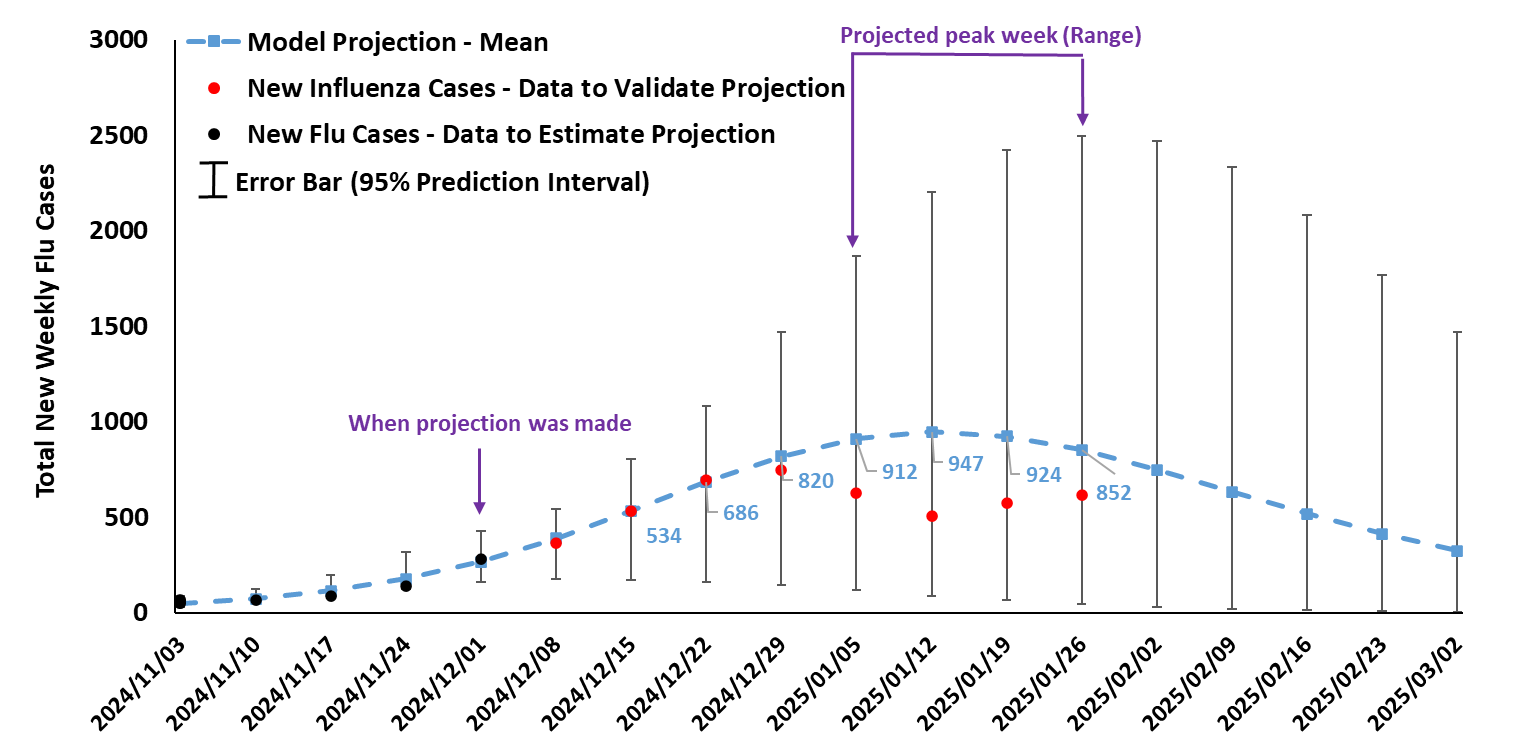
What to expect for week of February 2 to 9, 2025?
Influenza activities are projected to decline slowly after January 26, 2025

Projection made and publshed on : December 1, 2024
Data from the Alberta Respiratory Virus Dashboard will be plotted (red dots in the figure) for the remaining flu season.
How will this season compare to previous years?
Based on 10 years of historical influenza data, our model helps compare this season’s projections to trends from previous years.
Key takeaways:
- The projected peak time is anticipated to be later than flu seasons since 2017.
- The projected peak magnitude of cases is anticipated to range between average to higher than average compared to previous flu seasons.
- More information about previous flu seasons can be found here: Alberta Respiratory Virus Dashboard.
These insights highlight how influenza activity changes year-to-year, the expected impacts of the healthcare system (e.g., emergency room visits and hospitalization).
Who can use this information?
This forecast can serve as a critical planning tool for:
- Individuals and Families: Offering insight into peak periods to plan vaccinations and preventive measures.
- Healthcare Providers: Helping hospitals and clinics allocate resources effectively.
- Policymakers: Provide insights for public health strategies to help reduce flu impacts.
Ways to prevent the spread?
Influenza immunizations are an effective tool to help reduce risks for infection, hospitalization, and/or death. The vaccine effectiveness in Alberta during the 2023-2024 season was estimated at 61% for influenza A(H1N1) and 49% for influenza A(H3N2) (Smolarchuk et al., 2024). Please visit the Government of Alberta website for influenza for more information about influenza immunization, and find out where to have flu shots at pharmacies and Alberta Health Services public health clinics.
Other ways to help reduce the spread of influenza and other respiratory viruses include good hand hygiene, wearing a face mask, and staying home when feeling sick (for more information, visit the Guidance for Masks for the General Public from the Government of Alberta).
More About Our Model
Our forecasts use an Susceptible-Infectious-Recovered (SIR) model, which incorporates transmission dynamics and health behavior trends. This model is age stratified (<19, 19 to 64, 65+ years old) and comprising of a system of nine ordinary differential equations. This model is trained over ten historical influenza seasons using Bayesian methods (see Roda, 2020). Developed by leading experts, this model provides valuable predictions with data updates throughout the season. The vertical error bar describes uncertainties of the model projection (e.g., changes in influenza spread).
Can our predictions be validated?
As new weekly case data from the Alberta Respiratory Virus Dashboard is being plotted (red dots) onto the figure showing our projections, our predicted peak week can be compared to true peak week of the real data for accuracy. If the future data points lie within the error bars (95% prediction intervals), the predictions are considered accurate.
Mathematical Modelling Teams
|
Donglin Han (PhD student) Xuyuan Wang (PhD student) Tanjima Akhter (PhD student) Adriana-Stefania
Ciupeanu |
|
Acknowledgements
We would like to acknowledge the Health Analytics branch at Alberta Health for providing our teams with data including their knowledge about the data to help support this work. We would like to also acknowledge Alberta Health Services for providing insights on influenza testing and perspectives about clinical operations.
Disclaimer
The model projection is based on modelling assumptions related to transmission dynamics for influenza and have uncertainties related to factors such as transmission and health-seeking behaviour and are subject to change as more data becomes available.
Feedback or Questions
Leave any questions or comments by emailing:
Dr. Michael Li, myli@ualberta.ca
Dr. Marie Varughese, mvarughese@ihe.ca
Other Flu Forecasting/Surveillance Sites

