Information Research Lab, University of Alberta
2025-2026 Respiratory Virus Projections for Alberta
Influenza, COVID-19, and respiratory syncytial virus (RSV) are respiratory illnesses that spread through the air or on objects when an infected person sneezes, coughs, or talks, especially in the fall and winter months. When you are sick, symptoms can range from mild cold-like to more serious illness requiring hospitalization, particularly in young children, older adults, and those with underlying health conditions.
As influenza season approaches, being prepared is essential.
By understanding how influenza, COVID-19, and RSV might spread this season, proactive steps can be taken to reduce its impact.
This year, the mathematical modeling teams at the University of Alberta and the Institute of Health Economics are collaborating to provide quantitative forecasts on the time course of the respiratory virus season in the province, using weekly numbers of cases of influenza, COVID-19, and RSV as a measure of respiratory virus activity.
Our goal is to provide a reliable, science-based outlook to keep Albertan informed, prepared, and resilient against the seasonal challenges to protect their health.
What to expect this season:
Explore our model forecasts for the projected spread and peak period of weekly new influenza, COVID-19, and RSV cases for the 2025-2026 respiratory virus season in Alberta. We will plot the weekly case data (red dots) published on the Alberta Respiratory Virus Dashboard for comparison with our forecasted trajectory (average) for the remaining respiratory virus season to test the accuracy of the projection. When the new data diverges significantly from our earlier forecast, we will update the forecast using the new data.
Highlights:
What to expect for the week of February 13 to 19, 2026?
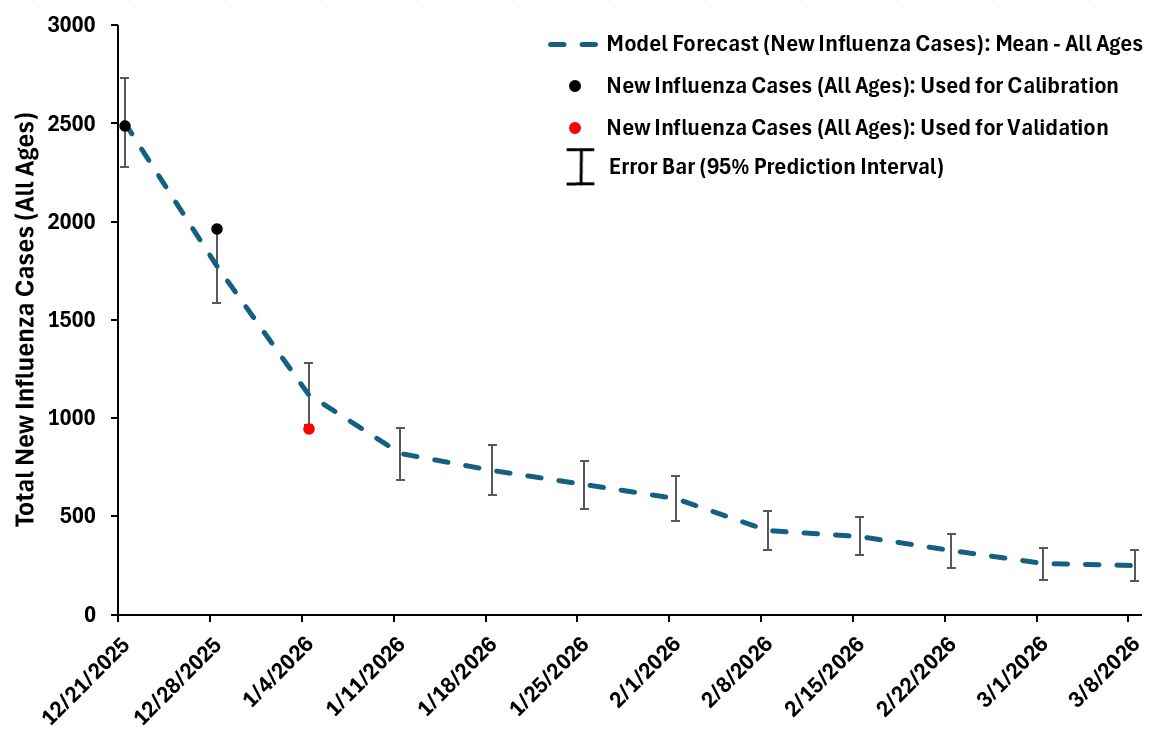
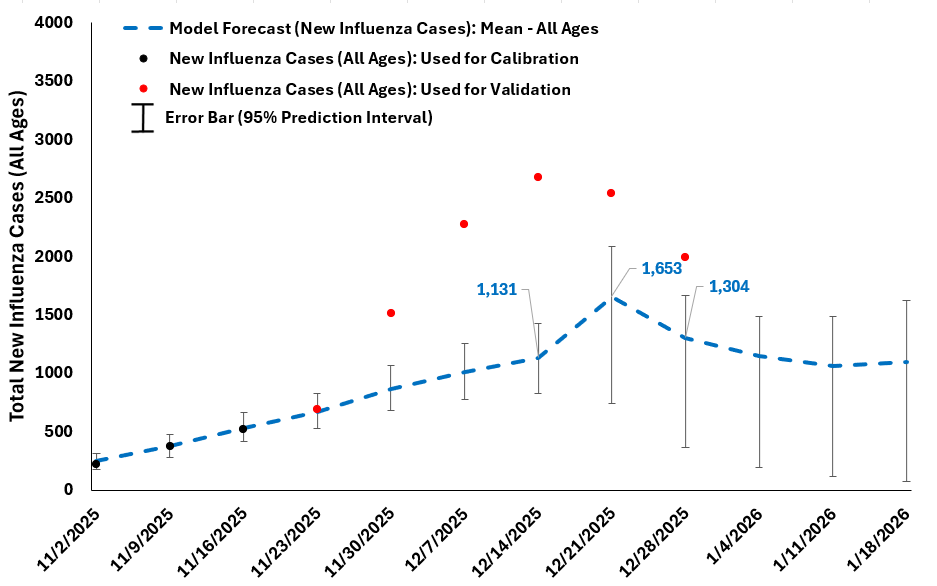
Influenza forecast on January 10, 2026, using data up to the week of December 28, 2025:
Influenza activity is forecasted to have peaked and is expected to decline over the coming weeks
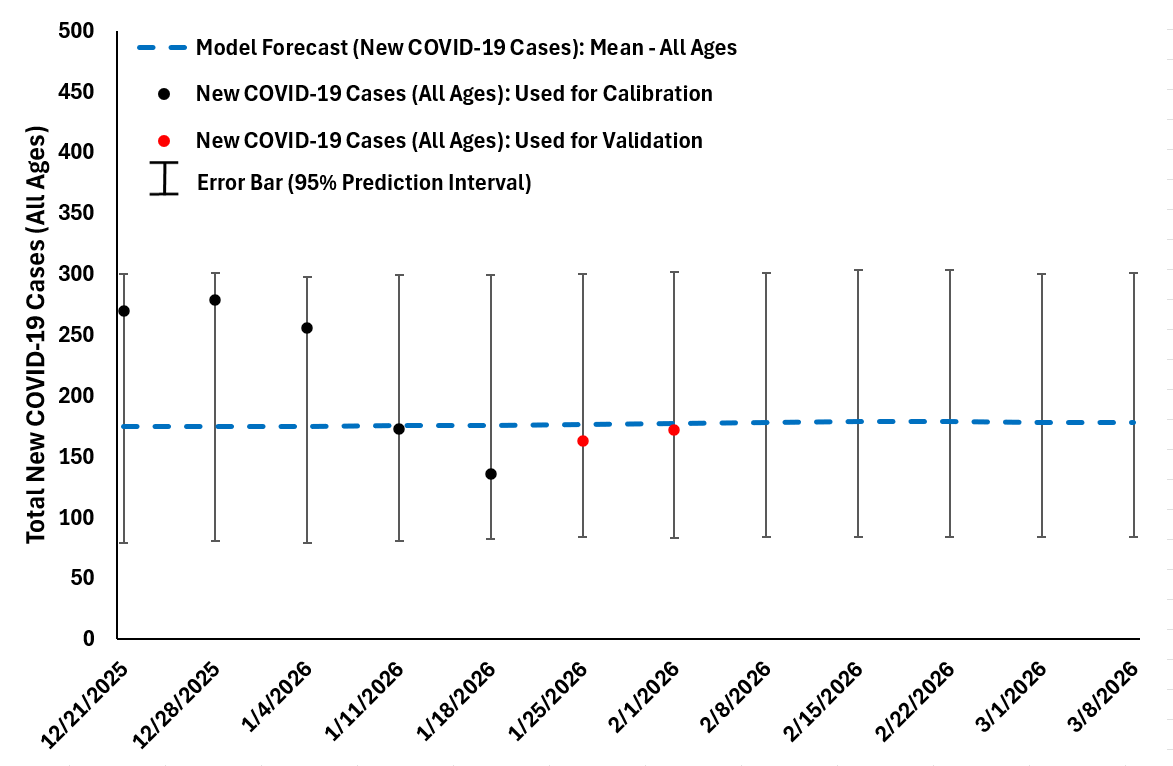
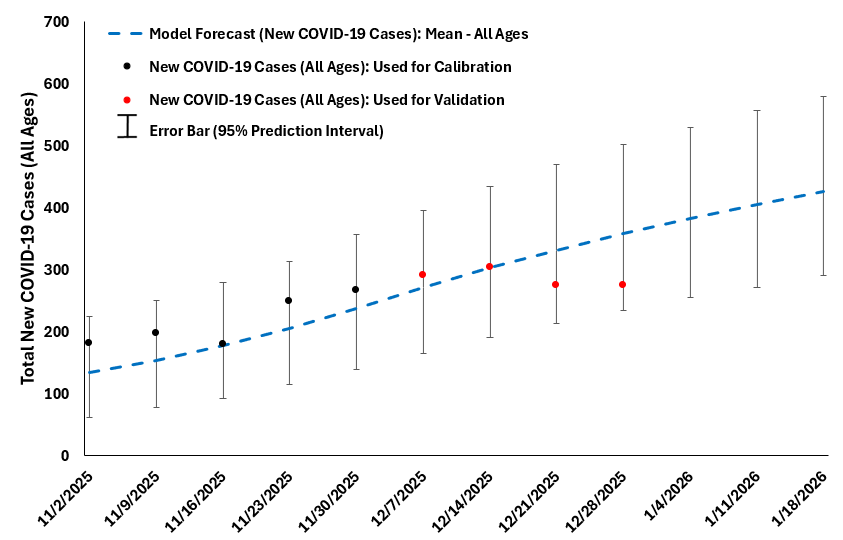
COVID-19 forecast on January 29, 2026 (blue curve), using data up to the week of January 18, 2026:
COVID-19 activity is forecasted to plateau over the coming weeks
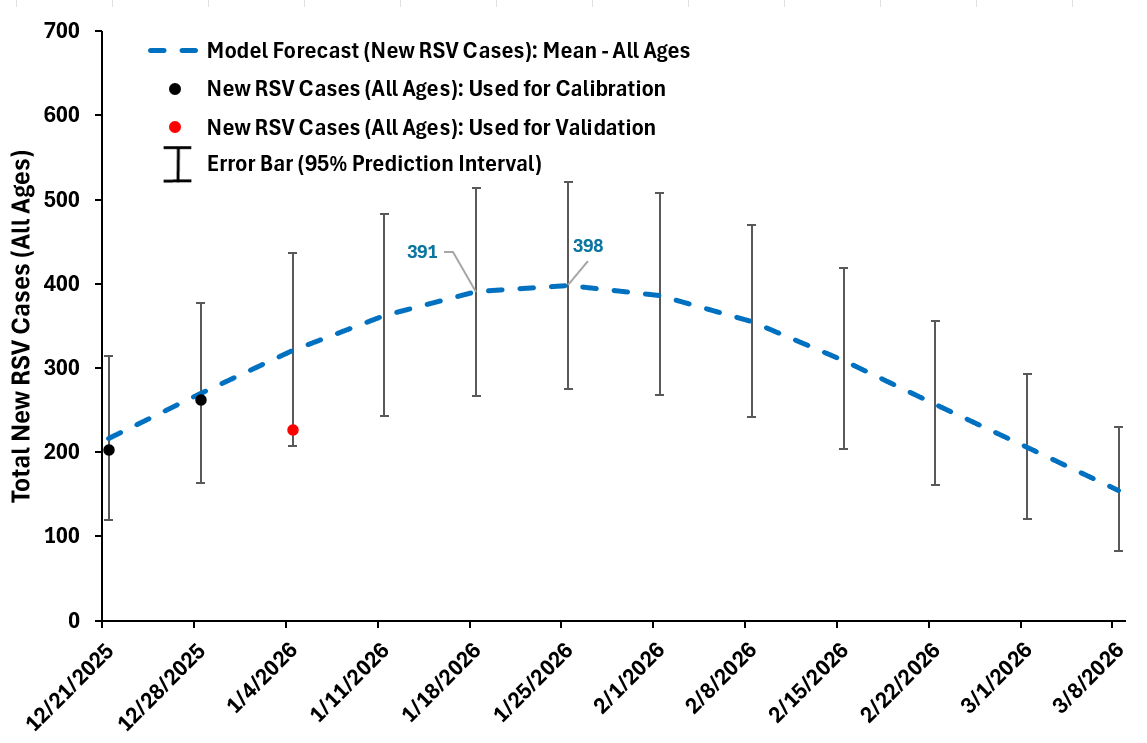
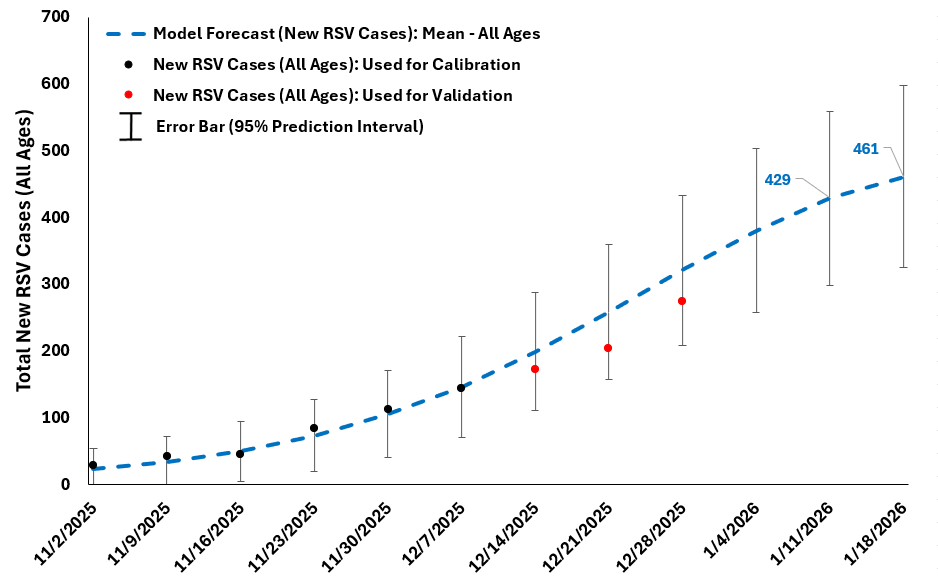
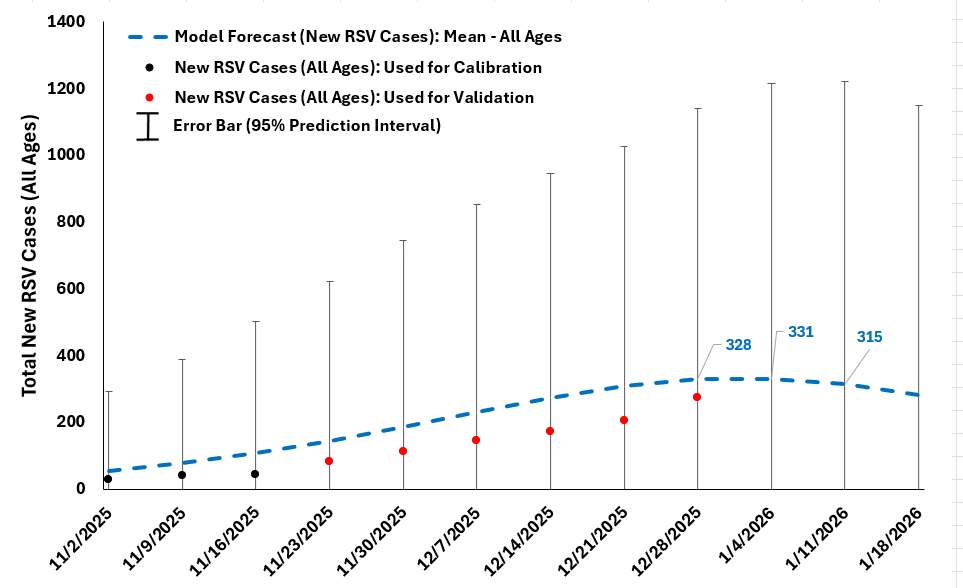
RSV forecast on January 10, 2026 (blue curve), using data up to the week of December 28, 2025:
RSV activity is forecasted to reach its peak around the week of January 25, 2026 followed by a decline in cases
Data from the Alberta Respiratory Virus Dashboard will be plotted (red dots in the figure) for the remaining flu season.
How will this season compare to previous years?
Key takeaways:
These insights highlight how respiratory virus activity changes year-to-year and the expected impacts on the healthcare system (e.g., emergency room visits and hospitalization).
Who can use this information?
This forecast can serve as a critical planning tool for:
Ways to prevent the spread?
Immunizations for respiratory viruses (influenza, COVID-19, and RSV) are an effective tool to help reduce the risks for infection, hospitalizations, and/or death. Please visit the Government of Alberta website for more information about immunizations and actions you can take to prevent the spread (influenza, COVID-19, and RSV). More information about vaccine effectiveness can be found here for influenza (Smolarchuk et al., 2024), COVID-19 (Separovic et al., 2025 & Ma et al., 2025), and RSV.
Other ways to help reduce the spread of respiratory viruses include good hand hygiene, wearing a face mask, and staying home when feeling sick (for more information, visit the Guidance for Masks for the General Public from the Government of Alberta).
More About Our Model
Our forecasts use a Susceptible-Infectious-Recovered (SIR) modelling framework, which incorporates transmission dynamics and health behavior trends. These models are age stratified (<19, 19 to 64, 65+ years old for influenza and COVID-19; and <2, 2 to 4, 5 to 18, 19 to 64, 65+ years for RSV) and comprising of a system of ordinary differential equations. This model is trained and informed using historical data for influenza (over ten seasons), COVID-19 (three seasons), and RSV (five seasons) using Bayesian methods (see Roda, 2020). Developed by leading experts, this model provides valuable predictions with data updates throughout the season. More information about methods can be found in our recent publication. The vertical error bar describes uncertainties of the model projection (e.g., changes in influenza spread).
Can our predictions be validated?
As new weekly case data from the Alberta Respiratory Virus Dashboard is being plotted (red dots) onto the figure showing our projections, our predicted peak week can be compared to true peak week of the real data for accuracy. If the future data points lie within the error bars (95% prediction intervals), the predictions are considered accurate.
Mathematical Modelling Teams
|
Donglin Han (PhD student) Xuyuan Wang (PhD student) Tanjima Akhter (PhD student) Jyoti Das (PhD student) Xinqi Xie (PhD student) |
Dr. Weston Roda Dr. Karsten Hempel Dr. Ellen Rafferty |
Acknowledgements
We would like to acknowledge the Health Analytics branch at Primary and Preventative Health Services for providing our teams with data including their knowledge about the data to help support this work. We would like to also acknowledge Alberta Health Services for providing insights on influenza testing and perspectives about clinical operations.
Disclaimer
The model forecasts are based on modelling assumptions related to transmission dynamics for influenza, COVID-19, and RSV and have uncertainties related to factors such as transmission and health-seeking behaviour and are subject to change as more data becomes available.
Feedback or Questions
Leave any questions or comments by emailing:
Dr. Michael Li, myli@ualberta.ca
Dr. Marie Varughese, mvarughese@ihe.ca
Forecasts in Previous Weeks of the 2025-26 Season
Here you can see the series of updates of our forecasts during the 2025-26 season.
Influenza Forecasts in Previous Weeks
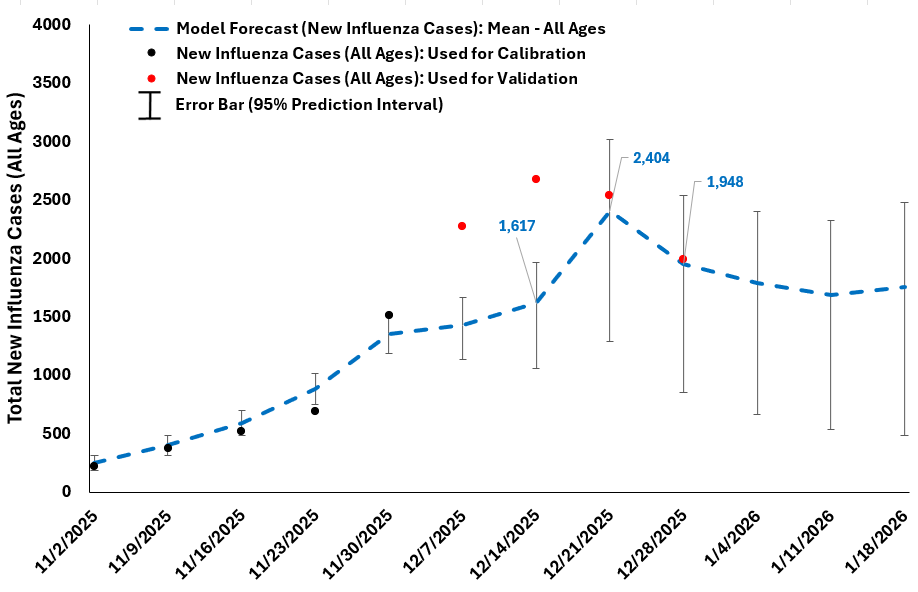
Influenza Forecast on December 12, 2025 (blue curve), using data up to the week of November 30, 2025.
Influenza Forecast on November 30, 2025 (blue curve), using data up to the week of November 16, 2025. COVID-19 Forecasts in Previous Weeks
COVID-19 forecast on December 24, 2025 (blue curve), using data up to the week of November 30, 2025:
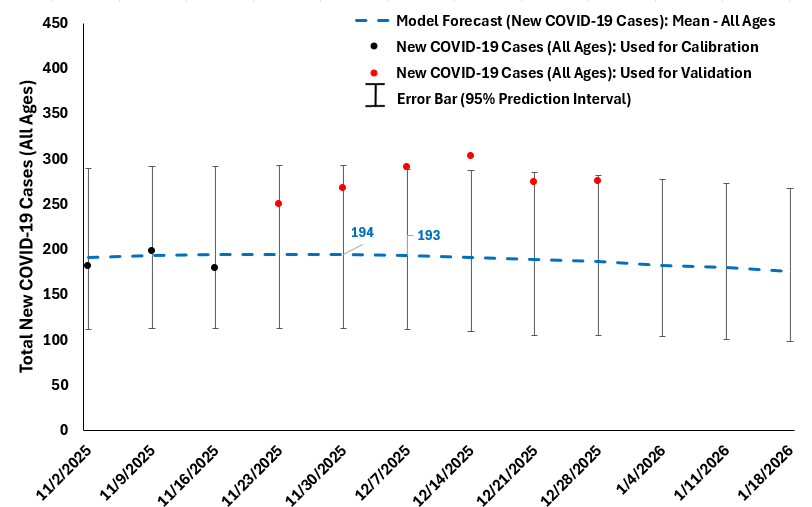
COVID-19 forecast on November 30, 2025 (blue curve), using data up to the week of November 16, 2025:
RSV Forecasts in Previous Weeks
RSV forecast on December 24, 2025 (blue curve), using data up to the week of December 7, 2025:
RSV forecast on November 30, 2025 (blue curve), using data up to the week of November 16, 2025:
Other Flu Forecasting/Surveillance Sites