antecedent
conditions
![]()
symptoms of
groupthink
![]()
symptoms of defective
decision making
![]()
low probability of
successful outcome
1. How do group dynamics affect decision making?
2. Explain the theory of groupthink. What are the antecedent conditions for and symptoms of groupthink? How can it be minimized? Give the pros and cons of the theory.
3. What happened to the space shuttle Challenger? What were the causes of the incident?
4. How does Meshkati propose large-scale systems failures be prevented?
5. What is Crew Resource Management (CRM), and how does it contribute to safety?
Francis Galton (1907):
- in 1906, Galton went to the annual show of the West of England Fat Stock and Poultry Exhibition at Plymouth (England)
- for sixpence, people guessed the weight of a slaughtered, “dressed” ox, to win a prize
- 787 people guessed, including butchers, farmers, and non-experts
- Galton borrowed the tickets and analyzed the results
- mean = 1,197 lbs.; median = 1,207 lbs.
- actual was _____ lbs. (group correctness was within 1%)
A ____ is a number of people who work together toward a common goal; teams have a defined membership.
- requires cooperation, coordination, & communication
e.g., a soccer team has the goal of winning the game
In contrast, a _____ of people who merely have something in common with other members.
e.g., this class is a group of people registered in this course; each of you is working toward your own goal of getting the best grade
Are group decisions simply the average of individual decisions?
Shouldn’t groups compensate for the _____ in reasoning of the individuals who comprise them?
What are the causes of error in group decision-making?
Irving Janis (1972, 1982)
- groupthink is “a mode of thinking that people engage in when they are deeply involved in a cohesive ingroup, when the members’ strivings for unanimity override their motivation to realistically appraise alternative courses of action” (1972, p.9)
- tendency for all members in a small, close-knit group to think _____, seek concurrence, and discourage dissent/disagreement
- others’ opinions count; you compare yourself to others; uniformity/social norms may develop within a group
- individuals do not want to be singled out as “different”:
• dissenters must debate their position with entire group
• if group fails to change dissenter’s mind, dissenter is ________
- social systems are tension systems: discrepancy between group norm and individual produces tension (e.g., cognitive __________)
Group: Unwritten goal is unanimity. Is individual rejected?
Individual: Do you (1) influence group to change? (2) change your own opinion? or (3) reject the group?
- thus, __________ is viewed positively
- groupthink model:
|
antecedent conditions |
|
symptoms of groupthink |
|
symptoms of defective decision making |
|
low probability of successful outcome |
Antecedent conditions:
A: Decision makers constitute a ________ group
(deindividuation causes group cohesiveness to supersede an individual’s freedom of expression)
B-1: __________ faults of the organization
1. insulation of the group
2. lack of tradition of impartial leadership
3. lack of norms requiring methodical procedures
4. homogeneity of members’ social background and ideology
B-2: Provocative ___________ context
1. high stress from external threats with a low hope of a better solution than the leader’s
2. low self-esteem temporarily induced by:
a. recent failures that make members’ inadequacies salient
b. excessive difficulties on current decision-making tasks that lower each member’s sense of self-efficacy
c. moral dilemmas: apparent lack of feasible alternative except ones that violate _______ standards
Symptoms of groupthink:
Type I: Overestimation of the group
1. illusion of _______________
- protects collective “ego” or self-image
2. belief in inherent ________ of group
Type II: Closed-mindedness
3. collective rationalization
- past success ![]() future success?
future success?
4. stereotyping of _________
- avoid, discredit outside/contrary opinions
Type III: Pressure toward uniformity
5. ____-__________
- dissenting opinions left unspoken
6. direct pressure on dissenters
7. self-appointed “__________”
- discourage others from expressing their beliefs
- suppress information
8. illusion of _________
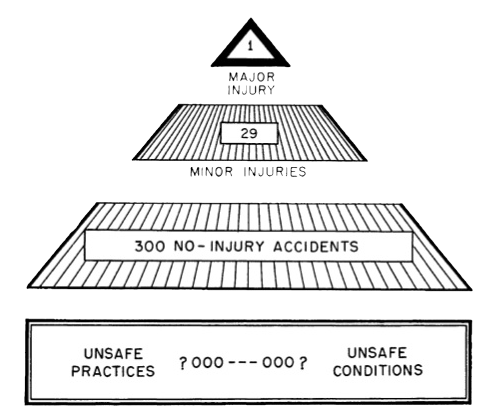
Symptoms of defective decision making (Janis & Mann, 1977):
1. incomplete survey of alternatives
2. incomplete survey of objectives
3. failure to examine risks of preferred choice
4. poor information ______
5. selective bias in processing given information
6. failure to reappraise alternatives
7. failure to work out contingency plans
Preventing groupthink:
1. leader should assign role of critical _________ to each group member
- encourage group to voice objections and doubts; leader must accept criticism of their own judgments
2. leader must be impartial when assigning task to a group
- should make unbiased statements, without advocating any preferences
3. set up several ___________ groups to work on the same problem, each under a different leader
4. divide into subgroups which meet separately, then come together to discuss any differences
5. have members discuss group's deliberations with _______ associates, and report their reactions back to the group
6. invite outside experts to challenge group's views
7. appoint one member as a “_______ ________” who voices policy alternatives to counter confirmation bias
8. attend to warning signals and possible intentions of rivals
9. after achieving consensus, have a “second chance” meeting for members to express remaining doubts
Pros & Cons:
![]() evidence: historical accounts of Pearl Harbor, Viet Nam war, Watergate, Chernobyl
evidence: historical accounts of Pearl Harbor, Viet Nam war, Watergate, Chernobyl
![]() evidence is based on post hoc reports that rely on fallible memory
evidence is based on post hoc reports that rely on fallible memory
![]() __________, often ambiguous definitions (e.g., of antecedents and symptoms)
__________, often ambiguous definitions (e.g., of antecedents and symptoms)
![]() systematic empirical evidence is _________; groupthink found in both good and bad decisions
systematic empirical evidence is _________; groupthink found in both good and bad decisions
Case Study: The Space Shuttle Challenger(Presidential Commission on the Space Shuttle Challenger Accident, 1986)
Background - launch of mission STS-51-L first scheduled for January 22, 1986 - postponed due to: • payload changes • bad weather forecast at abort landing site • dangerous crosswinds • “technical difficulties” (equipment problem) - rescheduled for January 28, 1986 - launch delayed until 11:38:00 a.m., due to ___ on launchpad - first problem at T+0.678: smoke spurt visible from aft field joint of right Solid Rocket Booster (SRB) - in the next 2 seconds, 8 more smoke puffs appeared - T+58.788: flame appeared - aerodynamic slipstream deflected flame plume onto External Fuel Tank - T+64.660: tank breached; liquid H2 fuel _______ - T+73: structural integrity lost; liquid O2 oxidizer ignited - all seven crewmembers died |
 |
Results of the Rogers Commission report (1986):
The Cause of the Accident:
• fluorocarbon _-____ (pressure seal) in aft field joint of right SRB failed to contain hot gases
• due to “a faulty ______ unacceptably sensitive to a number of factors”: temperature, physical dimensions, character of materials, effects of reusability, processing, and reaction of joint to dynamic loading (p.72)
• O-rings had previously showed signs of _______
The Contributing Cause of the Accident
• “The ________ to launch the Challenger was flawed.” (p.82)
• decision-makers unaware of contractors’ written recommendation advising against launch below 53 °F or 12 °C (launch date forecast: 26 to 29 °F or -3 to -2 °C)
• were also unaware of opposition by engineers, protesting management positions on launch
People involved in the launch decision:
Level I: NASA Associate Administrator for Space Flight
Level II: NASA National Space Transportation System Manager
Level III: NASA program managers for shuttle elements
- Johnson and Kennedy Space Centers
- Marshall Space Flight Center (responsible for SRBs)
Level IV: shuttle element ___________ (design & production)
- Rockwell International (orbiter maker)
- Morton Thiokol Inc. (MTI, SRB maker): managers and engineers (including Roger Boisjoly)
Information flows from Level IV up to Level I
Results
• MTI voluntarily forfeited $10 million of its fees in exchange for not being forced to accept _____ liability
• nine recommendations made on improving safety of the space shuttle program
• concluded that NASA’s organizational _______ and decision-making processes were key contributing factors to the accident
Moorhead, Ference, & Neck (1991): analyzed evidence for groupthink in the Challenger disaster
- antecedent conditions, groupthink symptoms, and decision-making defects present
- suggested additions to groupthink:
• ____ pressure (called “go fever” in the space industry)
• increased importance of leadership _____ (vs. personality)
- based on qualitative analysis
Esser & Lindoerfer (1989): attempted quantification of groupthink in the Challenger disaster
- overall analysis:
• antecedents: 11 positive, 6 negative
• consequences: 32 positive, 7 negative
- but based on Rogers Commission report:
![]() no influential ______
no influential ______
![]() no evidence for all ___________ (was group cohesive?)
no evidence for all ___________ (was group cohesive?)
![]() who comprised the “group”? Only Level III managers?
who comprised the “group”? Only Level III managers?
Schafer & Crichlow (1996): quantitative re-analysis of Janis’ crises
- correlated antecedents with information-processing errors
antecedent |
correlation |
group homogeneity |
<.01 |
high stress |
.01 |
group insulation |
.02 |
lack of methodical procedures |
.20 |
lack of impartial leadership |
.36 |
- not all antecedents equally _________
- alternative hypothesis:
|
|
information processing errors |
antecedents of groupthink |
|
|
|
|
unfavourable outcomes |
Hirokawa, Gouran, & Martz (1988): cognitive, psychological, and social influences
• beliefs:
- MT engineers warned against low-temperature launch; but managers believed secondary O-rings were _________
- management recommended launch delay until after noon--then reversed their decision
- also, no incident had occurred in the past, so managers believed that none would occur this time
(_________ fallacy: erroneously predicting an event based on expectation, not probability)
• questionable reasoning:
- management used “___________ judgment”: failure rate = 1 in 100,000
- working engineers set it at 1 in 100
- NASA/MT management knew that O-rings had eroded on previous flights without incident
- rings no more than 33% eroded, thus safety factor = 3?!
• _____________ context/perceived pressure:
- the shuttle program was intended to pay its own way by putting satellites into orbit
- this required an aggressive launch schedule, so the shuttle and components had to be prepped for relaunch quickly
- MT perceived pressure from NASA to launch; their contract was coming up for review
- the decision rule shifted from “convince me to launch” to “convince me ___ to launch”
- NASA painted a rosy picture, and began to believe it
• ineffective __________:
- engineering teams expressed concerns:
Rockwell: ice on launch pad
MT: O-ring integrity at low temperatures
- recommendations against launch not heeded by Level III or IV managers--why not?
- data not conclusive; based on _________
- due to ambiguous language, upper-level decision-makers had an unclear understanding of engineers’ concerns
e.g., “Rockwell cannot assure that it is safe to fly”
(Where’s the problem? In the _________? Or in the ______?)
Edward R. Tufte (1997):
- if it was so obvious what went wrong, why did it happen?
- proximal cause: no link between low temp & O-ring damage
- analysis was sound, but ____________ was unconvincing
“Temperature Concern on SRM Joints, 27 Jan 1986”
Diane Vaughn (1996): The Challenger Launch Decision: Risky Technology, Culture, and Deviance at NASA
- O-rings originally classified “C 1-R” (criticality 1, having __________): failure would mean the loss of the shuttle and crew
- changed to more serious “C 1” in 1982
- one reliability engineer working for NASA’s Safety, Reliability, and Quality Assurance Program (SR&QA) was responsible for catching errors in miscategorization
- information overload: engine problem summaries books were 8 cm thick
- the ______________ contribution to a technological systems failure is underestimated
- _____________ of deviance: even though behaviours clearly violate safety rules, people within an organization become accustomed to them if they do not immediately cause a catastrophic failure
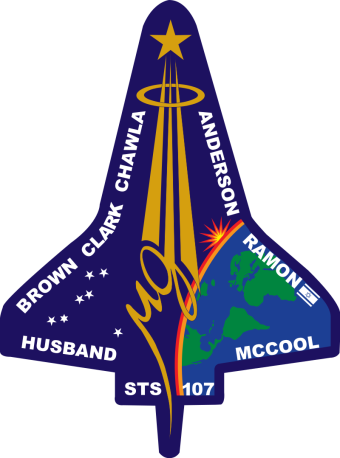
Space Shuttle Columbia mission STS-107 (February 1, 2003) - during launch, a piece of foam insulation broke off from the external fuel tank and struck the shuttle’s left wing, damaging the thermal protection - although some engineers were concerned that the damage was serious, NASA managers prevented further investigation, saying nothing could be done while the shuttle was in orbit - upon re-entry, the damaged wing broke apart and the shuttle was destroyed - Columbia Accident Investigation Board (CAIB, 2003): • criticized NASA’s organizational and ______ _______, and its decision-making and risk-assessment procedures e.g., some NASA managers were responsible for safety, on-time launches, and costs--which are often mutually exclusive • foam strikes had occurred before, but were viewed as an accepted risk, and not as a safety-of-flight issue • NASA accepted deviations from design criteria as normal: normalization of deviance • evidence was also found for __________ (Dimitroff et al., 2005) |
 |
Meshkati (1991): Human factors in large-scale technological systems’ failures
1. ______
- operators must be well-integrated with system
- consider user in the design
- design social/organizational structure as well
2. _________
- operators must handle situations not in manuals
- thus, they must understand workings of the system
3. ______
- take “human error” as indication system may be at fault
- determine reasons for the error; prevent reoccurrence
Total System Design (Bailey, 1982; 1989):
- proposed as a macroergonomic approach to the design of large-scale technological systems
(macroergonomics is the design of work systems which focuses on organization-system interaction)
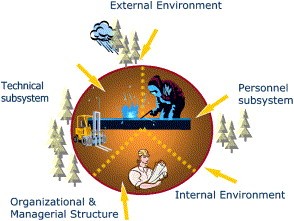
- human factors should inform design and development
- at each stage of development, from design to implementation of a system, all major systems components should be examined in terms of how they will ________:
• technological
• human (operators’ abilities)
• organizational & __________ (communication)
![]() United Airlines flight 173 (NTSB, 1979):
United Airlines flight 173 (NTSB, 1979):
- McDonnell Douglas DC-8 on approach to Portland International Airport, Dec. 28, 1978
- aircraft delayed southeast of the airport at a low altitude for about 1 hour
- flight crew coped with a landing gear malfunction; prepared passengers for the possibility of a landing gear failure upon landing
- failed to gauge the amount of fuel left for flight--situation became ____ __________ emergency
- aircraft ran out of fuel and crashed in a residential area about 6 miles southeast of the airport
- of 181 passengers and 8 crewmembers aboard, 8 passengers, the flight engineer, and a flight attendant were killed; 21 passengers and 2 crewmembers were injured seriously
- primary causes: the captain failed to:
• properly monitor aircraft’s fuel state
• respond to low fuel state
• and respond to ____________ advisories regarding fuel levels
- contributing factors: the other two flight crew members failed to:
• fully comprehend criticality of the fuel state
• successfully communicate their concern to the captain
- fundamental problem was team communication
- _________ speech: uses indirect or ambiguous language when raising concerns, instead of speaking directly or giving orders
• language is expressed in a way that attempts either to be polite or to show deference to authority
• found to be a less effective means of eliciting a desired response
- this incident was the precipitating event leading to a NASA-led workshop on air safety in 1979, which led to the creation of aviation psychology and CRM (Cooper et al., 1980)
Crew Resource Management (a.k.a. Cockpit Resource Management; Helmreich et al., 1999; Kanki et al., 2019):
- definition: training flight crews to reduce “pilot error” by enhancing ____ aspects of flight operations, including interpersonal communication, leadership, situation awareness, and decision making (Diehl, 2013)
- views the captain not as the pilot, but as the team leader
- aviation has gone beyond “stick-and-rudder” skills to include _____ resources as critical components of flying
- the field of human factors, too, has gone beyond “knobs and dials” to incorporate behavioural and social sciences, engineering, and physiology
- the team level must be examined as the majority of crew errors consist of failures in leadership, team coordination, and decision-making
- depends on the existence of psychological ______: a belief that one will not be punished or humiliated for speaking up with ideas, questions, concerns, or mistakes, and that the team is safe for interpersonal risk-taking (Edmondson, 1999, 2023)
- this in turn fosters safety culture
Example: Southwest Airlines CRM procedures when noticing departure from safety procedures (Brafman & Brafman, 2008)
1. state the _____
e.g., “our approach speed is off”
2. _________: use first name, and add quantifier to the fact
e.g., “Mike, are you going to make it on this approach? Check your altitude.”
3. take ______
e.g., go on radio and say, “Southwest 1 going around. We’re too high for approach” so tower controller will cancel landing clearance. This way, there is no fighting over the controls. Then go around and try approach again.
- these procedures are intended to flatten the _________ gradient
First Generation Cockpit Resource Management
- originally modeled closely on training called __________ Grid (Blake & Mouton, 1964), which classifies five different leadership styles based on concern for people versus concern for production
- emphasized changing of individuals’ self-diagnosed style, and correcting deficiencies
e.g., lack of assertiveness by juniors, and authoritarian behaviour by captains
- conducted in an intensive _______ setting
- first comprehensive CRM program implemented by United Airlines in 1981
Second Generation Crew Resource Management
- by the mid-1980s, many airlines began CRM training
- focus changed to _____ ________ among the crew, hence the change in terminology
- training started to include team building, briefing strategies, situation awareness, and stress management
- in 1989, CRM was credited for being responsible for the large number of survivors in the crash of United Airlines flight 232
- in 1990, the FAA made CRM training mandatory; Transport Canada has not yet published CRM training standards
Third Generation CRM
- by the early 1990s, CRM training was broadened to include flight attendants, flight dispatchers, and maintenance personnel
- however, this may have _______ the original focus on human error
Fourth Generation CRM
- by the mid-1990s, CRM was an integral part of all flight training; not run as separate seminars
- CRM training includes situational awareness, problem solving, decision making, communications, and teamwork
Pros & Cons:
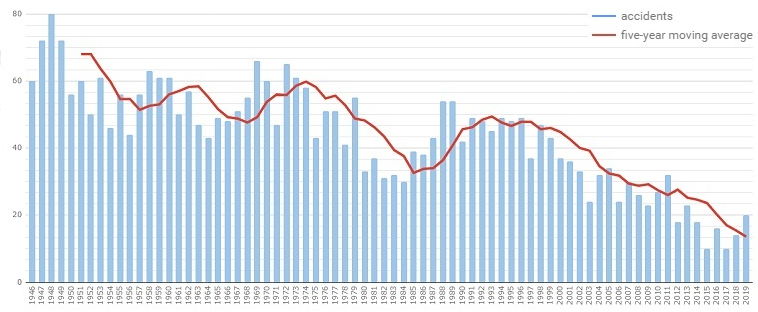
![]() likely helped reduce airliner _______ (Flight Safety Foundation, 2020, 2025)
likely helped reduce airliner _______ (Flight Safety Foundation, 2020, 2025)

![]() CRM has been successfully applied to industries like military aviation, anesthesiology, maritime shipping, railroads, emergency services, space exploration, construction & mining, law enforcement, firefighting and nuclear power plants (McKinney et al., 2005)
CRM has been successfully applied to industries like military aviation, anesthesiology, maritime shipping, railroads, emergency services, space exploration, construction & mining, law enforcement, firefighting and nuclear power plants (McKinney et al., 2005)
![]() easier to get acceptance in High Uncertainty Avoidance cultures
easier to get acceptance in High Uncertainty Avoidance cultures
e.g., Greece and Korea prefer rule-governed behaviour and clearly defined procedures
![]() but difficult to get acceptance in High Power Distance cultures
but difficult to get acceptance in High Power Distance cultures
e.g., China and many Latin American countries stress the absolute authority of leaders; junior crewmembers from these cultures may not challenge the captain
![]() some pilots (“cowboys” or “_______”) reject the concepts of CRM; general acceptance may slip over time
some pilots (“cowboys” or “_______”) reject the concepts of CRM; general acceptance may slip over time
Next Generation CRM?
- a majority of pilots hold ___________ attitudes about their ability to perform at a high level
- underlying premise should be that human error is ubiquitous and inevitable--so CRM should be viewed as a countermeasure against error
- CRM training should include instruction on cognitive errors, and the deleterious effects of stressors, fatigue, work overload, and emergencies