Download the SEQSIM software here.
Download the SEQSIM Detailed README here.
Download the preprint here.
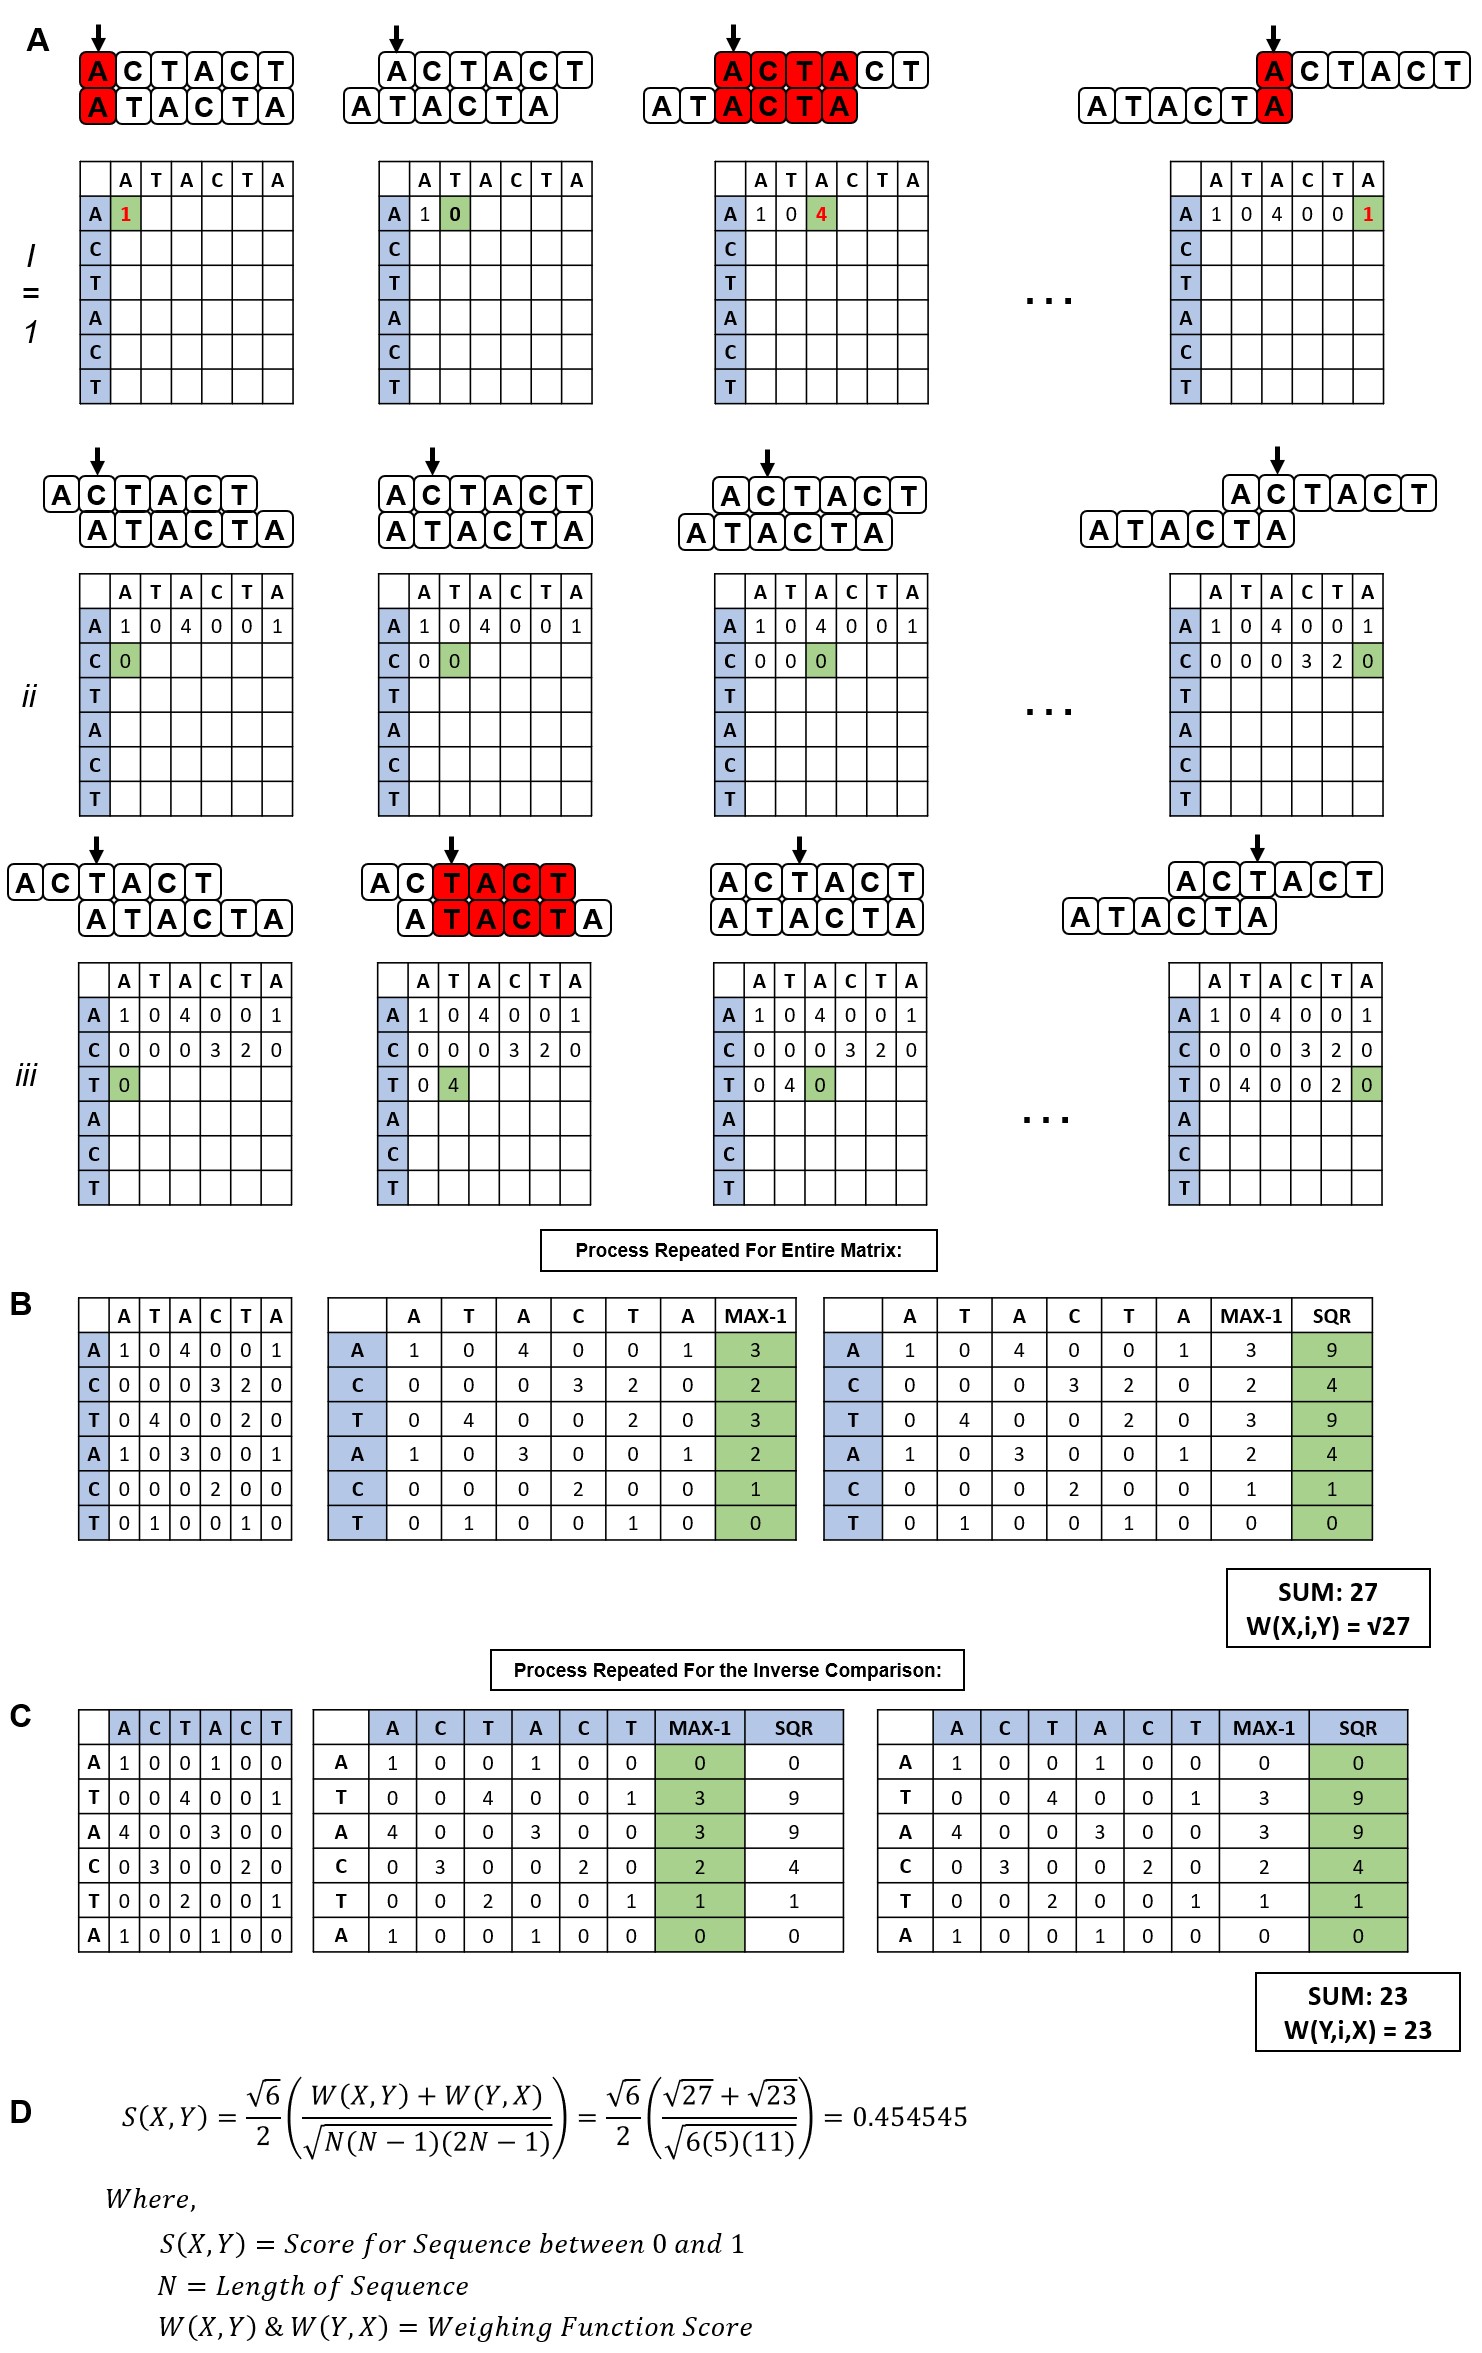
Supplementary Figure 1 - Step-by-step method of determining the values of the weighing functions and scoring algorithm. (A) (i) Using the sequences X = ACTACT and Y = ATACTA, Sequence Y is moved one nucleotide at a time and compared to Sequence X. If a match is found, +1 is added to the score at that position and moves onto the next nucleotide for each sequence. A +1 is added to the score until there is a mis-match. This is done for the entire Row 1, or Position 1 of Sequence X. (ii) Depicts the same scoring system for Position 2 of Sequence X, and (iii) depicts this process on Position 3 of Sequence X. (B) After the entire table is completed, the maximum score at each position in Sequence X is extracted and 1 is subtracted from the value. The new value is then squared. The sum of all the positions in Sequence X is the value of Weighing Function W(X,i,Y). (C) The same calculation is conducted for the comparison of Sequence X to the base Sequence Y. (D) The Weighing Function values are substituted into the overall Scoring Function to calculate an overall score for Sequence X vs Sequence Y which results in a score between 0 and 1, 1 being 100% homologous.
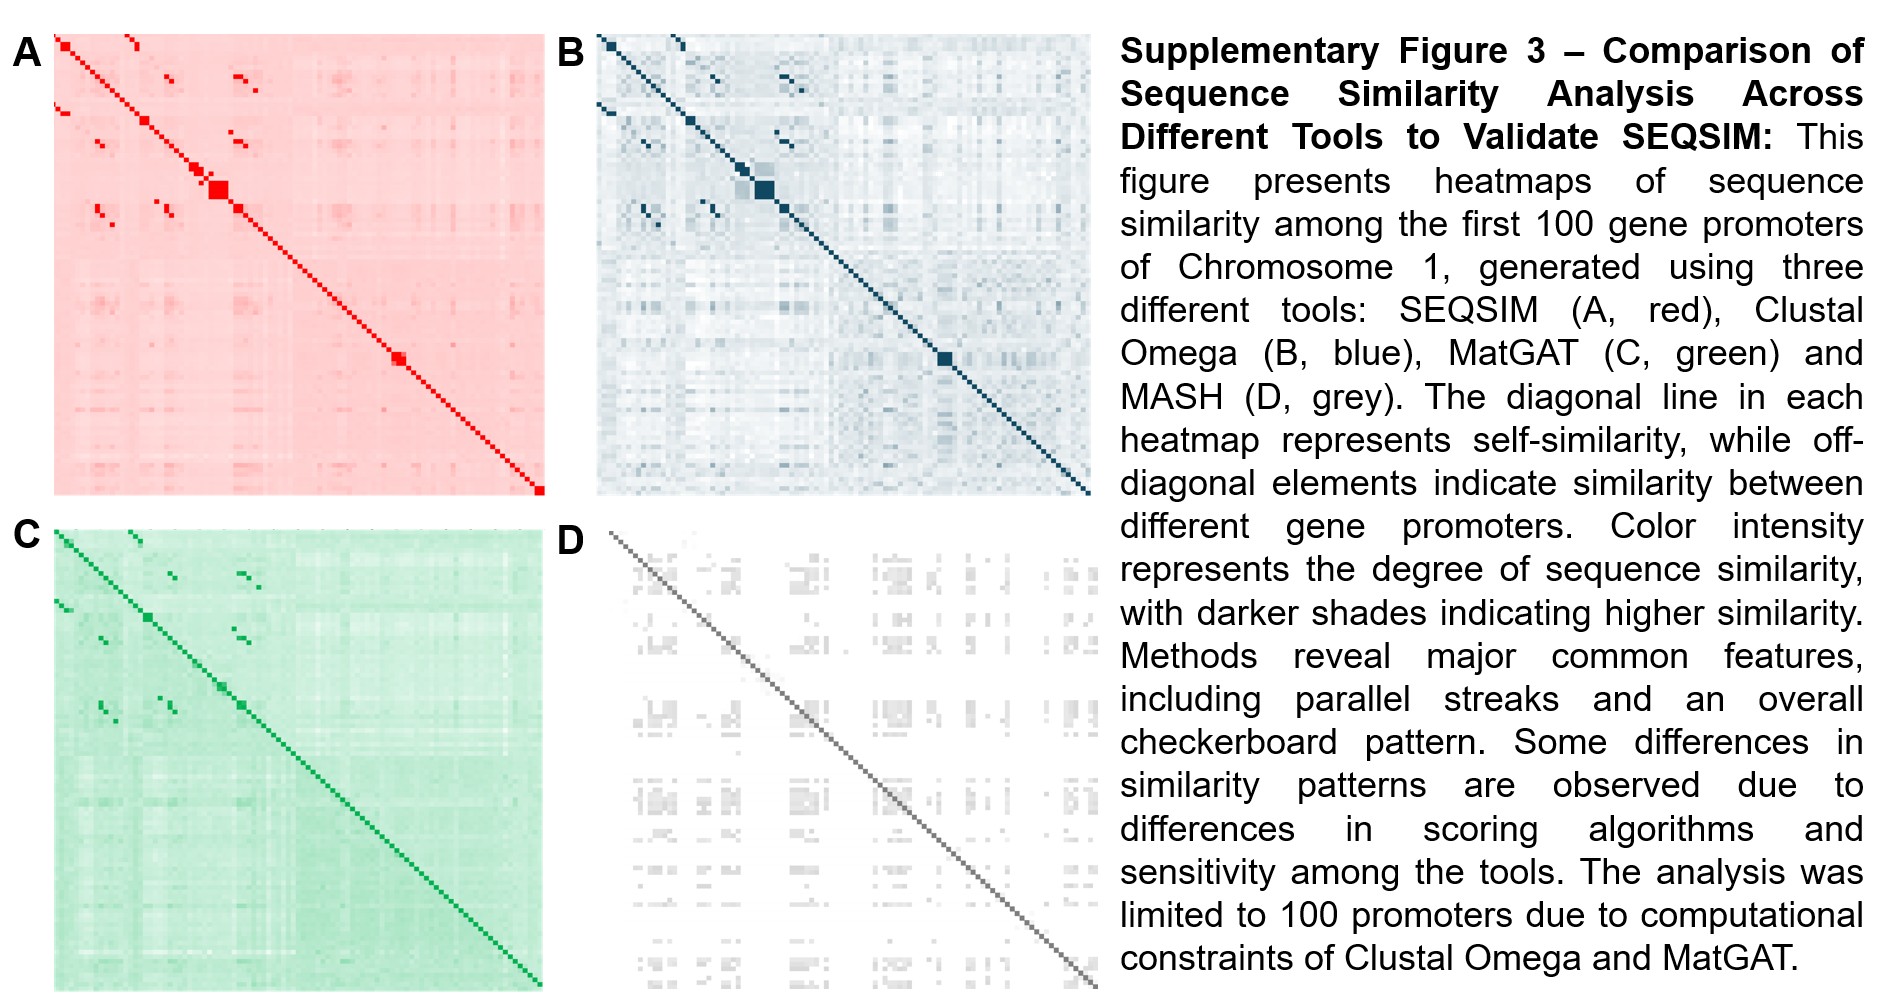
Supplementary Figure 3 - Comparison of Sequence Similarity Analysis Across Different Tools to Validate SEQSIM: This figure presents heatmaps of sequence similarity among the first 100 gene promoters of Chromosome 1, generated using three different tools: SEQSIM (A, red), Clustal Omega (B, blue), MatGAT (C, green) and MASH (D, grey). The diagonal line in each heatmap represents self-similarity, while off-diagonal elements indicate similarity between different gene promoters. Color intensity represents the degree of sequence similarity, with darker shades indicating higher similarity. Methods reveal major common features, including parallel streaks and an overall checkerboard pattern. Some differences in similarity patterns are observed due to differences in scoring algorithms and sensitivity among the tools. The analysis was limited to 100 promoters due to computational constraints of Clustal Omega and MatGAT.
Supplementary Table 1: Comparison of SEQSIM with representative alignment-free (AF) and pairwise similarity methods. Methods are evaluated based on their algorithmic approach, emphasis on contiguous sequence matches, output format, typical use cases, and their relation to SEQSIM. This comparison highlights SEQSIM’s unique ability to detect long, high homologous regions in promoter sequences at genome scale.