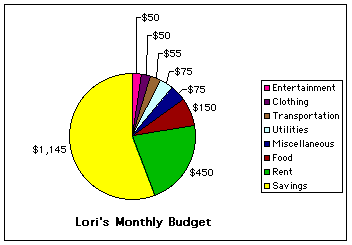
a) Determine Lori's expenses
- Rent
- Utilities
- Transportation (bus pass)
- Food
- Entertainment
- Clothing
- Miscellaneous
- Utilities
-
- b) Determine how much she should spend on each item
-
- Rent--$450
- Utilities--$75
- Transportation (bus pass)--$55
- Food--$150
- Entertainment--$50
- Clothing--$50
- Miscellaneous--$75
- Rent--$450
-
- c) Add all the expenses together
-
- $450 + $75 + $55 + $150 + $50 + $50 + $75 = $855
- $450 + $75 + $55 + $150 + $50 + $50 + $75 = $855
- d) Subtract Lori's expenses from her income
-
- $2000 - $855 = $1145
- $2000 - $855 = $1145
- Lori should be able
to put $1 145 towards her future schooling every month.
- e) Represent information in a Pie Graph
