Clevis Joint Monte Carlo Simulation
by D.S.Nobes (Win2026).
Determine the clearance probability distribution for a clevis joint assembly.
Assembly Diagram
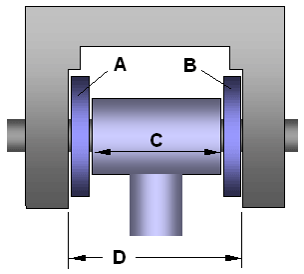
Clearance = D - (A + B + C)
Dimension Ranges (mm)
Simulation Settings
Mean Clearance
-- mm
Std Deviation
-- mm
Min / Max
-- / --
Interference Risk
-- %
(Clearance < 0)
Clearance Probability Distribution
Histogram showing the relative frequency (probability) of resulting clearance values across all simulation runs.
About this Simulation
This Monte Carlo simulation utilizes the selected distribution (Uniform or Gaussian/Normal) for each dimension based on the provided min/max ranges. For the Gaussian distribution, the min and max are assumed to represent the ±3σ (sigma) tolerance limits. It iterates the specified number of times, generating random dimensions to calculate the resulting assembly clearance.