J Pharm Pharmaceut Sci (www.cspscanada.org) 9(2):158-164, 2006
Development of a sensitive and specific liquid chromatography/mass spectrometry method for the quantification of cucurbitacin I (JSI-124) in rat plasma.
Ommoleila Molavi, Anooshirvan Shayeganpour, Vishwa Somayaji, SamarHamdy, Dion R. Brocks, Afsaneh Lavasanifar, Glen S. Kwon and John Samuel.
Faculty of Pharmacy and Pharmaceutical Sciences, University of Alberta, Edmonton, Alberta, Canada. School of Pharmacy, University of Wisconsin, Madison, WI, USA
Date received: March 14 2006, Revised: May 26 2006, Accepted: June 7 2006, Published July 4 2006
Corresponding Author: Dr. John Samuel, Faculty of Pharmacy and Pharmaceutical Sciences, 3118 Dentistry Pharmacy Centre, University of Alberta, Edmonton, Email: jsamuel@pharmacy.ualberta.ca
ABSTRACT: PURPOSE: To develop a liquid chromatography/mass spectrometry (LC-MS) method for the quantitative analysis of cucurbitacin I (JSI-124), an anti-cancer inhibitor of the janus kinase 2/signal transducer and activator of transcription 3 (JAK2/STAT3) signaling pathway, in rat plasma samples. METHODS: Standard samples of cucurbitacin I were prepared from a stock solution (1 mg/mL) in methanol. Internal standard (I.S.) was 4-hydroxybenzophenone. Extraction of cucurbitacin I and I.S. from rat plasma was performed using acetonitrile/dichloromethane. LC-MS analyses were performed using a Waters Micromass ZQ 4000 spectrometer, and chromatographic separation was achieved using a Waters XTerraMSC18 3.5 µm (2.1×50 mm) column as the stationary phase. The mobile phase consisting of a mixture of acetonitrile: water containing 1% formic acid with initial ratio of 20:80, employing a linear gradient to a final ratio of 40:60 v/v over 13 minutes, was delivered at a constant flow rate of 0.2 mL/min. The mass spectrometer was operated in negative ionization mode and analytes were quantified with single ion recording (SIR) at m/z 559 for cucurbitacin I and m/z 196.8 for I.S. RESULTS: Calibration curves with r2> 0.999 were constructed over the concentration range of 5-10000 ng/mL for the solution of cucurbitacin I in methanol and 10-1000 ng/mL for rat plasma samples. The extraction recoveries were 86 and 98% for 50 ng/mL and 1000 ng/mL plasma concentration of cucurbitacin I, respectively. The intra- and inter-day coefficients of variation were less than 15%, and mean intraday errors were less than 10% at plasma concentration extending from 10-1000 ng/mL. CONCLUSION: The developed assay is sensitive, specific, reproducible and reliable for quantitative analysis of cucurbitacin I. Application in a pharmacokinetic assessment was proven in the rats given the drug.
INTRODUCTION
Cucurbitacin I ( 17 - ( 1 , 5 – Dihydroxy – 1 , 5 –dimethyl – 2 – oxo – hex – 3 – enyl ) – 2 , 16 -dihydroxy 4, 4, 9, 13, 14 – pentamethy - l7, 8, 9, 10, 12, 13, 14, 15,16,17 – decahydro - 4H - cyclopenta[a] phenanthrene - 3, 11 - dione) is an anti-cancer agent with potent and selective inhibitory effects on janus kinase 2/signal transducer and activator of transcription 3 (JAK2/STAT3) signaling pathway. Cucurbitacin I has been also named JSI-124 due to its inhibitory effect on JAK2/STAT3 pathway (1). This compound belongs to a group of natural products called cucurbitacins, tetracyclic triterpinoid substances which have been isolated from various plant families such as Cucurbitaceae. Cucurbitacins, which are well-known for their bitterness, also possess a broad range of potent biological activity derived largely from their cytotoxic properties (2). A number of compounds of this group have been investigated for their hepatoprotective, anti-inflammatory, antimicrobial, and most importantly anti-cancer properties (2-4).
Cucurbitacin I is a strong inhibitor of the STAT3 signaling pathway, which has been considered as a promising target for cancer therapy (1, 5). STAT3, a common oncogenic signaling pathway, is constitutively activated in many types of cancers (5), including 82% of prostate cancers (6), 70% of breast cancers (7), more than 82% of the carcinomas of the head and neck (8), and 71% of nasopharyngeal carcinomas (9). Constitutively activated STAT3 has been shown to play a major role in tumor cell growth, resistance to apoptosis and immune evasion by cancer.
Accumulating evidence shows that blocking aberrant activation of STAT3 in tumor results in the inhibition of cancer cell growth, induction of apoptosis and enhancement of anti-cancer immune responses (5, 10-12). On the basis of the above observation, STAT3 has been proposed as a valid target for the development of novel anti-cancer drugs. Cucurbitacin I is a small molecule which has been shown to inhibit constitutive activation of STAT3 in several cancer cell lines in vitro, facilitate tumor rejection in a murine carcinoma model in vivo and modulate tumor induced immunosuppression. These studies have indicated the potential application of cucurbitacin I for STAT3 targeting in cancer therapy (1, 13, 14).
An important procedural aspect of new drug development and research is the establishment and validation of a satisfactory analytical method for the conduction of pharmaceutical and pharmacokinetic studies. To our knowledge, a few analytical methods have been reported for the analysis of cucurbitacins in plants and organic solutions (15, 16). Since the concentration of a natural compound such as cucurbitacin I in the plasma and other biosamples after dosing is always much lower than that in its organic extracts from plants, the previously developed methods may not be suitable for pharmacokinetic studies. The main purpose of this study was to develop and validate a sensitive and reproducible liquid chromatography-mass spectrometry (LC-MS) method for quantitative analysis of cucurbitacin I in non-biological samples and rat plasma. The assay has been validated in order to meet the accepted criteria for bioanalytical method (17).
MATERIALS AND METHODS
Materials:
Cucurbitacin I (Figure 1A) was purchased from Calbiochem (San Diego, California, USA). 4-hydroxybenzophenone (Figure 1B) was used as internal standard (I.S.) from Sigma, Aldrich chemical company (Milwaukee, USA). Methanol, acetonitrile, dichloromethane, water (all HPLC grades) and formic acid 88% were purchased from Fisher Scientific (Fair Lawn, NJ, USA).
Liquid chromatography/ mass spectrometry conditions.
LC-MS analyses were performed using a Waters Micromass ZQ 4000 spectrometer, coupled to a Waters 2795 separations module with an autosampler (Milford, MA, USA).
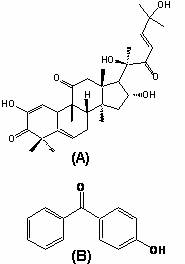
Figure 1. Chemical structure of A) cucurbitacin I and B) 4-hydroxybenzophenone (I.S.).
The mass spectrometer was operated in negative ionization mode with selected ion recorder (SIR) acquisition. The nebulizer gas was obtained from an in house high purity nitrogen source. The temperature of source was set at 150°C, and the voltages of the capillary and cone were 3.11 KV and 24 V, respectively. The gas flow of desolvation and the cone were set at 550 and 80 L/h, respectively. Chromatographic separation was achieved using a Waters (Milford, MA, USA) XTerraMSC18 3.5 µm (2.1×50 mm) as the stationary phase. The mobile phase consisting of a mixture of acetonitrile: water containing 1% formic acid with initial ratio of 20:80, employing a linear gradient to a final ratio of 40:60 v/v over 13 minutes, was delivered at a constant flow rate of 0.2 mL/min. 4-hydroxybenzophenone was used as I.S. SIR at m/z 559.14 corresponding to [M-H+ formic acid] ion and at m/z 196.8 related to [M-H] ion were selected for quantification of cucurbitacin I and I.S., respectively.
Standard and stock solutions
A stock solution of cucurbitacin I was prepared by dissolving 1 mg of cucurbitacin I in methanol. The solution was stored at -20ºC between experiments. The working solution of cucurbitacin I was prepared fresh each day by making a 100-fold dilution of the stock solution in methanol. The calibration standards were then prepared by serial dilution of the working solution. The stock solution of the I.S. was prepared by dissolving 5 mg of 4-hydroxybenzohpenone in 5 mL methanol, followed by the preparation of a working solution of 10 mg/mL by a further 100-fold dilution of the stock solution. The stock solution of I.S was stored at -20ºC between experiments and working solution of I.S. was prepared monthly from stock solution and was stored at 4 ºC.
Extraction procedure
To extract cucurbitacin I from plasma samples, 0.3 mL acetonitrile and 0.05 mL of I.S solution were added to 0.1 mL of rat plasma in a 1.5- mL polypropylene centrifuge tube, which was briefly vortex-mixed to precipitate plasma proteins. The supernatants were transferred to clean glass tubes containing 0.3 mL HPLC grade water and 3 mL dichloromethane, vortex-mixed for 30 seconds and centrifuged at 3000 × g for 3 min. The resultant organic solvent layer was transferred to new tubes and evaporated to dryness in vacuo. The dried samples were reconstituted with 0.2 mL of methanol and an aliquot of 10 mL was injected into the LC-MS system.
Recovery
The extraction efficiency was determined by comparing peak area ratios between cucurbitacin I and I.S. of known amounts of cucurbitacin I in methanol directly injected to LC-MS (unextracted) to that of plasma samples containing the same amounts of cucurbitacin I in plasma after extraction. The recoveries were assessed at concentration of 50 and 1000 ng/mL using 4 replicates at each concentration.
Calibration, accuracy and validation
Calibration curves were constructed over the quantification limit 5-10000 ng/mL for the solution of cucurbitacin I in methanol and 10-1000 ng/mL for plasma samples. The ratios of cucurbitacin to I.S. peak areas were calculated and plotted vs. cucurbitacin I concentration. Due to the wide range of concentrations, data for calibration curves were weighted by a factor of 1/concentration for plasma samples. The method was tested in a 3-day validation protocol for quantification of cucurbitacin I in plasma samples. Selectivity, linearity; precision and accuracy of quantification were assessed. A total of five replicates for each concentration were used for the determination of intra-day precision and accuracy. The inter-day precision and accuracy were determined for three independent experimental assays of the aforementioned replicates. Precision was assessed by coefficient of variation, which was calculated as:
![]() and
and ![]()
Bias was assessed by determining percent error, which was calculated as:
![]() and
and ![]()
Animal study
To test the applicability of the developed method in vivo, three Sprague-Dawley rats (0.3 kg), were cannulated the day before the experiment in right jugular vein with Micro-Renathane tubing (Braintree Scientific, Braintree, MA) under halothane anesthesia as previously described (18). The protocol was approved by the University of Alberta Health Sciences Animal Policy and Welfare Committee. Cucurbitacin I was solublized by the aid of 0.25 % DMSO in 5% glucose isotonic solution and injected to the rats at the dose of either 1.5 mg/kg or 1 mg/kg. Moreover micellar formulation of cucurbitacin I was prepared by poly(ethylene oxide)-block-poly(caprolactone) copolymer and injected intravenously to the rat at a dose of 0.4 mg/kg. Blood samples (100-200 mL) were nominally collected from the cannula at 0.083, 0.25, 0.75, 1, 2 and 3.5 h after dosing. Blood samples were immediately centrifuged for 3 min and the plasma was separated and stored at -30ºC until analysis which was performed shortly after the experiment. The plasma concentration of cucurbitacin I was analyzed by the developed and validated LC-MS method and the time to plasma concentration curve was profiled.
RESULTS
The mass spectra of cucurbitacin I and I.S. dissolved in methanol with 1% formic acid is shown in figure 2. The molecular ion at m/z of 559 corresponding to [M-H + formic acid] and m/z of 196.8 related to [M-H] were selected for quantification of cucurbitacin I and I.S., respectively.
Figure 2. Mass spectra of A) cucurbitacin I and B) I.S in methanol containing 1% formic acid. Figure 3. shows the single ion recorder (SIR) chromatograms of cucurbitacin I and I.S in methanol. Peaks of cucurbitacin I and I.S. are well separated in the established chromatographic condition. The retention times of cucurbitacin I and I.S. were approximately 12 and 11 min, respectively, and the analytical run time was 15 min.
Figure 3. SIR chromatograms of A) cucurbitacin I and B) I.S in methanol monitored at 559 m/z for cucurbitacin I and 196.8 m/z for I.S.
SIR chromatograms of cucurbitacin I and I.S. in rat plasma are shown in figure 4. The chromatogram of cucurbitacin I in the plasma sample from the rat received cucurbitacin I by i.v route showed that there was no endogenous plasma component interfering with this compound (Figure 4C).
Figure 4. SIR Chromatograms of cucurbitacin I in rat plasma: A) blank rat plasma; B) blank plasma spiked with 100 ng/mL cucurbitacin I and I.S.; C) rat plasma after 3.5 h, i.v injection of 0.4 mg/kg cucurbitacin I.
The regression analysis of cucurbitacin I was constructed by plotting the peak-area ratio of cucurbitacin I to I.S. versus analyte concentration (ng/mL). The calibration curve was linear (r2>0.999) within the range of 5-10000 ng/mL for the solution of cucurbitacin I in methanol as well as 10-1000 ng/mL of the compound extracted from rat plasma samples (Figure 5).
Figure 5. A representative standard curve for cucurbitacin I in methanol extending from 5-10000 ng/mL (A) and in rat plasma extending from 10-1000 ng/mL (B).
The average extraction recoveries were 86 and 98% at the concentration of 50 and 1000 ng/mL of cucurbitacin I in 0.1 mL plasma, respectively. The assay coefficient of variation at all of the intraday and interday assessment was less than 15%, and the mean intraday error in rat plasma was less than 10% (Table 1). The lower limit of quantification of the assay based on the mean error and CV% results was 10 ng/mL.
In order to test whether this method can satisfy the needs of a pharmacokinetics study, three rats were injected through i.v route with either 1.5 mg/kg or 1 mg/kg single dose of cucurbitacin I solubilized in 5% glucose solution with 0.25% DMSO or 0.4 mg/kg single dose of a micellar formulation of cucurbitacin I. The plasma concentration vs. time profile could be studied for up to 3.5 h after dosing with the micellar formulation and up to 2 h after i.v injection of drug solution in 5% glucose (Figure 6).
The rat injected with the micellar formulation did not experience any overt signs of toxicity with the drug, but the two other rats injected with either 1.5 mg/kg or 1mg/kg of cucurbitacin I solubilized in isotonic glucose solution appeared to have labored breathing within 1 h after the dose was administered, and perished shortly after the 2 h blood sample was withdrawn.
The data using the administered micellar formulation appeared to fit well to a one compartment open model, although there was a suggestion of a distribution phase from time of dosing to 0.75 h postdose (Figure 6). The terminal half-life was estimated to be 1.4 h in the rat. The distribution phase was more apparent in the data of the rat given the non-micellar formulation, and within 2 h the concentrations fell to near to the lower limit of quantitation even with the higher dose compared to the rat given the micellar formulation.
Figure 6. Plasma concentration vs. time profiles of A) cucurbitacin I solubilized in 5% glucose solution with 0.25% DMSO and given at a dose of 1.5 mg/kg by intravenous bolus injection B) cucurbitacin I given in micellar formulation at a dose of 0.4 mg/kg by intravenous bolus injection.
DISCUSSION
The assay described in this paper is highly specific, sensitive and reproducible for the quantitative analysis of cucurbitacin I in non-biological solvents as well as rat plasma samples. The calibration curves were highly linear over a wide range of concentrations (Figure 5).
The extraction procedure used in this work yielded good recoveries as well as high repeatability. These two requisites are of great importance when an analytic method needs to be validated for providing reliable data. Another notable advantage of the current method is that it uses a stable and commercially available internal standard.
The specificity of the LC-MS method makes the determination of this compound in the presence of other endogenous and exogenous plasma component possible. The chromatographs of cucurbitacin I and I.S. in rat plasma (Figure 4) showed that no significant interfering peak was co-eluted with the cucurbitacin I and I.S. After administration of the drug to the rat, there was no evidence in the chromatogram of chromatographic interference (Figure 4C).
The analytical precision data (Table 1) demonstrate the robustness and reproducibility of the developed method as well as its high sensitivity. The detection limit of the method is as low as 10 ng/mL in rat plasma allowing quantification of cucurbitacin I at low concentrations in body fluids. The application of the developed LC-MS method for a pharmacokinetic study was successful (Figure 6). Determination of drug levels in body fluids such as plasma is important in general unknown screening, toxicological evaluations, and in pharmacokinetic studies to guide the tailoring of the dose for newly developed pharmaceutical components.
In conclusion, we have described the first LC–MS method for the quantitative analysis of cucurbitacin I in plasma. The reproducibility, specificity and high sensitivity of the method allows for the selective and reliable determination of cucurbitacin I in rat plasma.
Table 1. Validation data for cucurbitacin I in rat plasma. Five replicates per concentration were included for each intraday run.
Expected concentration of cucurbitacin I (ng/mL) |
Intraday mean± SD measured concentrations (intraday CV% in parenthesis), (ng/mL) |
Interday mean±SD measured concentrations, (ng/mL) |
Interday CV (%) |
Interday mean error (%) |
||
10 |
11.8±1.45 |
11.5±1.60 |
10.4±1.44 |
11.2±0.73 |
13.3 |
9.55 |
25 |
28.7±3.29 |
25.3±2.97 |
28.0±3.54 |
27.3±1.79 |
12.0 |
1.27 |
100 |
107±10.0 |
100±7.35 |
86.1±6.26 |
97.9±10.8 |
7.98 |
7.20 |
500 |
434±18.8 |
520±17.2 |
488±10.8 |
481±43.4 |
3.29 |
-2.26 |
1000 |
989±4.48 |
960±46.2 |
997±39.6 |
982±20.0 |
3.08 |
-1.63 |