J Pharm Pharmaceut Sci (www.cspscanada.org) 9(2):231-237, 2006
Determination of Free Concentration of Paclitaxel in Liposome Formulation
Florin Marcel Musteata and Janusz Pawliszyn
Department of Chemistry, University of Waterloo, Waterloo, Ontario, Canada
Received, March 29, 2006; Revised July 4, 2006; Accepted, July 25, 2006; Published, July 28, 2006.
Corresponding author: Dr. Janusz Pawliszyn, Department of Chemistry, University of Waterloo, Canada; E-mail address: janusz@uwaterloo.ca
ABSTRACT: Purpose. An important step in the development of liposome-based formulations is estimating the free drug concentration in the aqueous solution surrounding liposomes. This research presents a new method for determination of free concentrations, based on membrane-protected solid-phase microextraction (SPME). Methods. For effective direct extraction of low molecular weight compounds from complex liquid samples, a hollow membrane was used to form a concentric sheath around a coated SPME fiber. The membrane blocked the access of large particles, like liposomes, to the coating surface, while target analytes with low molecular weight diffused through the membrane and reached the extraction phase. Quantification was conveniently performed by reversed-phase liquid chromatography coupled to electrospray ionization mass spectrometry. Results.The carbowax/templated resin SPME fiber was determined to be the most suitable for these assays, providing enough sensitivity when an extraction time of one hour was used. The free concentration of paclitaxel was found to be 0.36 µg/mL, significantly below the solubility limit of paclitaxel in water. Conclusion. The method was successfully applied for determining free paclitaxel in liposome formulations based on dioleyl-trimethyl-ammonium-propane, with good linearity over the range of concentrations of interest. The method was faster and more practical than equilibrium dialysis, as the SPME approach provided preconcentration and convenient delivery to the analytical system.
INTRODUCTION
Paclitaxel is a taxane diterpene amide that was first extracted from the stem bark of the western yew (Figure 1). This natural product is highly effective in treating various human neoplastic diseases, including gastric, ovarian, breast, lung, head and neck cancer and refractory leukemia (1-3). Paclitaxel acts at the cellular level by promoting the polymerization of tubulin toward stable microtubules, which results in stabilizing tubulin polymers against depolymerization. Its binding to microtubules prevents cell division but does not affect DNA, RNA or protein synthesis. In preclinical and clinical studies the biological and pharmacological effects of paclitaxel have been shown to be correlated to concentration as well as to duration of exposure (4).
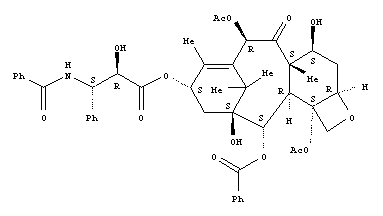
Figure 1. Paclitaxel chemical structure
Despite the major benefits of these pharmaceutical products based on paclitaxel, patients receiving chemotherapeutic treatment can experience severe to life-threatening side effects, primarily myelosuppression and neutropenia. On the other hand, underdosage might result in suboptimal treatment of cancer (5). In addition to its narrow therapeutic range, paclitaxel also displays highly variable pharmacokinetics and extremely poor water solubility. Intravenous administration of paclitaxel is associated with multiple side effects related to its pharmaceutical formulation (6). This problem is sought to be alleviated either by synthesizing more soluble derivatives or by administration of paclitaxel bound to formulation vehicles (7). Reduced side effects are observed with recently developed micelles and liposome-based formulations (8).
Liposomes, small artificial vesicles formed from one or more layers of lipid, are used medicinally to carry a drug, vaccine, or enzyme to targeted cells in the body. An important step in the development of liposome-based formulations is estimating the free drug concentration in the aqueous solution surrounding liposomes.
Several methods have been developed to measure the free concentration of drugs, and most involve the physical separation of free and bound fractions followed by conventional analysis (9,10). Examples of separation techniques include equilibrium dialysis, ultrafiltration, ultracentrifugation, and gel filtration. These techniques are usually time consuming, can suffer loss of analyte to membranes, can generate errors due to protein leakage or Donnan effects, and can create a shift in concentrations and binding equilibrium during separation (11-13). Furthermore, when dialysis is used, drug concentration and sample volume have to be determined on both sides of the separation membrane, increasing the complexity of an experiment.
Solid phase microextraction (SPME) has been applied to the determination of free concentrations, but only in the case of an interaction between a drug and a specific protein (14-17). Direct extraction of target analytes from complex matrices is usually hindered by various matrix effects such as fouling and disturbance of uptake kinetics. Interfering compounds or suspended particles can be adsorbed by the fiber coating during direct SPME. Consequently, they cause calibration problems and preclude fiber reusability. To overcome these problems, a hollow membrane is used to form a concentric sheath around a coated SPME fiber.
The resulting method is a simple and sensitive SPME approach for characterizing paclitaxel – liposome interaction, which provides the distribution constant and the free concentration of paclitaxel.
EXPERIMENTAL SECTION
Paclitaxel and liposomes loaded with paclitaxel were supplied as research samples by an undisclosed industrial partner. The liposomes had a diameter of 200 nm and were constituted of dioleyl-trimethyl-ammonium-propane. Ammonium acetate and acetic acid were obtained from BDH Inc (Toronto, ON, Canada); HPLC grade acetonitrile and methanol were purchased from Fisher Scientific (Fair Lawn, NJ). Deionized water was obtained using a Barnstead/Thermodyne NANO-pure ultrapure water system (Dubuque, IA). Carbowax-templated resin (CW-TPR, 50 µm, for HPLC) and polyacrylate (PA, 85 µm) SPME fibers were obtained from Supelco (Bellefonte, PA); PEEK tubing and nuts were received from Upchurch Scientific (Oak Harbor, WA); dialysis membranes were purchased from Spectra/Por Biotech Membranes (Rancho Dominguez, CA).
Membrane-protected SPME
Protection of SPME fibers with porous membranes prevents the direct interaction between the extraction phase and liposomes, allowing accurate determination of free paclitaxel in liposome formulations (18,19). The membranes used for this task had a molecular weight cut-off of 15 kD (for proteins) and 10 nm pore size; according to the manufacturer’s instructions, they were soaked in water for 24 h prior to analysis.
The SPME fiber was placed inside the flat membrane, both sides of the membrane touching the fiber (Figure 2). Great care was taken to avoid including air in the space between the fiber and membrane (if some air becomes trapped in this space, it must be eliminated by application of slight pressure on the membrane or by introducing the device in a low vacuum vessel). Both ends of the dialysis membrane were kept out of the liquid sample or, alternatively, one of the ends was sealed.
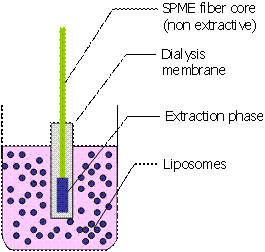
Figure 2. Experimental setup for determination of free paclitaxel with membrane-protected SPME.
Apparatus and Analytical Conditions
LC-MS analyses were performed using an Agilent 1100 series liquid chromatograph (Agilent Technologies, Palo Alto, CA, USA), equipped with a vacuum solvent degassing unit, a binary high pressure gradient pump, an autosampler, a column thermostat and a variable wavelength UV-VIS detector coupled on-line with an Agilent 1100 series MSD single quadrupole instrument with atmospheric pressure electrospray-ionization. High purity nitrogen used as nebulizing and drying gas was generated with a Whatman nitrogen generator (Whatman, Haverhill, MA, USA).
Chromatographic separations were carried out on a 150 ´ 2.1 mm id column packed with 5 µm C8-silica particles (Agilent Technologies), guarded by an on‑line filter (0.2 µm). Data were collected and analyzed using the CHEMSTATION software from Agilent Technologies.
LC and ESI-MS conditions were as follows: column temperature 25°C, mobile phase acetonitrile : 2 mM ammonium acetate pH=4.85 (with acetic acid) 50:50, flow rate 200 µL/min, nebulizer gas N2 (35 psi), drying gas N2 (8 L/min, 320°C), capillary voltage 5000 V, fragmentor voltage 155 V, quadrupole temperature 100°C, positive ionization mode. For optimization experiments, scan mode in the range 100-1500 amu was used; for paclitaxel quantification experiments, selected ion monitoring (m/z = 876.3) was used, with a scan time of 0.42 sec / cycle and a dwell time of 400 ms. All other parameters of the mass-selective detector were automatically optimized using a calibration standard.
A homemade interface consisting of a Valco zero-volume tee piece with an enlarged thru-hole was used as an in-line desorption chamber for the SPME fiber, as previously described (20, page 426). The autosampler was programmed to switch the mobile phase flow through the interface two minutes after inserting the fiber, allowing for elution of the desorbed compounds. New fibers were conditioned by exposing them to the mobile phase flow for 30 minutes or until a smooth baseline was detected.
Standard Solutions and Sample Preparation
Stock solutions of paclitaxel (1 mg/mL) were prepared weekly in methanol and kept refrigerated at 4°C; no evaporation was observed over one week period. Working standard solutions were obtained by further dilutions with water, and were stable for at least one week in the refrigerator. All aqueous solutions were prepared at a concentration below the solubility limit of paclitaxel. The liposome solution was prepared from lyophilized liposomes and water, as indicated by the manufacturer.
For extraction, the sample was placed on an orbital shaking platform. The sample consisted of 1 mL standard solution or 1 mL reconstituted liposomes. The membrane protected CW/TPR fiber was immersed in the sample for exactly one hour. The SPME fiber was then quickly rinsed with water, inserted into the HPLC desorption chamber (with mobile phase) and allowed to undergo static desorption for two minutes; subsequently, the content of the interface was flushed directly onto the HPLC column for separation and detection (21). Fibers were unceasingly in contact with the mobile phase and therefore immediately available for reuse. The carryover was below the limit of detection.
RESULTS AND DISCUSSION
Initial investigations were performed with two different coatings: CW/TPR and PA. Maximum sensitivity was obtained with the CW/TPR coating (Figure 3), which was used for further experiments.
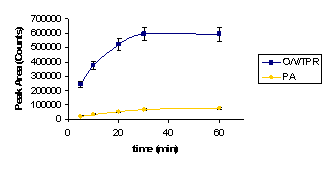
Figure 3. Extraction time profile for paclitaxel (0.3 μg/mL standard solution, no liposomes) by direct SPME with two different coatings: CW/TPR and PA.
Even though the interaction of the CW/TPR coating with the liposomes was found to be minimal, the high concentration of lipids in solution (60 mg/mL) precluded separation of free paclitaxel (~ 0.3 μg/mL) by direct SPME. The radius of liposomes in the pharmaceutical formulation was relatively large, 200 nm, but generally they are elastic and able to pass through much smaller pores. In order to avoid attachment of liposomes to the coating, the fiber was introduced inside a dialysis membrane of 10 nm pore size (Figure 2). The samples were stirred at 60 rpm on a shaker for various times ranging from 15 minutes to 24 hours. With this procedure, the equilibration time exceeded 24 h (Figure 4), due to the slow diffusion through the pores of the membrane. However, the reconstituted liposomes were stable only for 4 hours (when the lipid membranes start to coalesce), and a longer extraction time could not be used. As an alternative to equilibrium extraction, pre-equilibrium extraction can be used when the sensitivity of the analytical procedure is high enough (20). The amount of analyte extracted in pre-equilibrium conditions is proportional to the free (diffusible) concentration of a sample, as shown in Equation 1:
![]()
(1)
where n is the number of moles of analyte extracted, Kfs is the distribution coefficient of the analyte between the fiber coating and sample matrix, C0 is the concentration of a given analyte in the sample, Vf is the volume of the fiber, t is the extraction time, and a is a time constant, representing how fast an equilibrium can be reached (22).
Inspection of the extraction time profile in Figure 4 revealed that the amount of paclitaxel extracted by the membrane-protected CW/TPR fiber in one hour was sufficient for accurate determination.
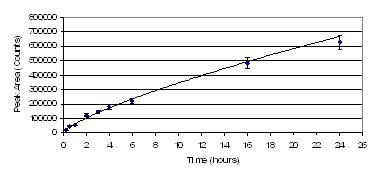
Figure 4. Extraction time profile for paclitaxel (0.3 μg/mL) obtained with membrane-protected SPME.
Consequently, one hour extraction time was used for constructing a calibration curve and determining the concentration of free paclitaxel. Calibration was performed over the range of 0.05 – 0.4 μg/mL, that completely covers the expected range of free concentration values (Figure 5).
The total concentration of paclitaxel in the investigated aqueous or liposomal solutions was checked, before and after extraction, by diluting the solution with methanol and direct HPLC analysis. No significant change in the concentration of paclitaxel was observed, as expected, because the amount of paclitaxel extracted in 1h with the SPME fiber is much less than 1% of the total amount of paclitaxel in the system.
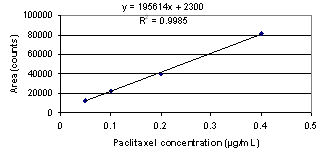
Figure 5. Calibration curve for paclitaxel, obtained with membrane-protected SPME. The extraction time is 1 h; samples were shaken at 60 rpm.
Assay of Free Paclitaxel in a Liposome Formulation
The liposome solution was prepared according to the manufacturer: a specified amount of lyophilized liposomes was mixed gently with 0.92 volumes of water to obtain one volume of final solution. The solution was then allowed to maturate at room temperature for 30 minutes, for the liposomes to stabilize and distribute homogeneously in solution. Due to the relatively high quantity of paclitaxel contained in the liposomes, the danger of contamination was significant. Great care was taken to avoid exposure of the unprotected fiber (without membrane) to the liposomes and to avoid leakage of the sample through the ends of the membrane. Several samples of liposomes were investigated and the average concentration of free paclitaxel was found to be 0.36 μg/mL (Table 1).
Table 1 . Assay of free concentration of paclitaxel in liposome solution.
Paclitaxel Peak Area |
Paclitaxel concentration |
Average concentration (µg/mL) |
RSD% |
67027 |
0.331 |
0.36 |
8.5% |
67148 |
0.332 |
||
77607 |
0.385 |
||
80265 |
0.399 |
||
72568 |
0.359 |
A comparative study based on equilibrium dialysis was attempted, but the results were not reproducible. Again, the time required to reach dialysis equilibrium was very long, beyond the stability of the liposomes.
Determination of Paclitaxel Distribution Constant
The distribution constant of paclitaxel between liposomes and water was determined as
![]() (2)
(2)
The concentration of paclitaxel in water was considered to be the one determined with SPME in the previous step. The total concentration of paclitaxel in the reconstituted liposome solution was expected to be 10 mM, according to the manufacturer’s instructions. This value was verified as follows: the liposomes were diluted 1:100 with methanol, sonicated for 10 minutes (to break the liposomes and release paclitaxel), and further diluted with water. The final solution was analyzed by HPLC, and the total concentration of paclitaxel was found to be close to the one indicated by the manufacturer. Because the liposomes were found to contain more than 99.99% of the drug, the molar concentration of paclitaxel inside the liposomes was approximated as the ratio between the total amount of paclitaxel and the volume of lipids (0.125 M). The concentration of paclitaxel in water was considered 0.36 µg/mL, corresponding to 4.59×10‑7 M. Finally, the distribution constant was calculated with equation 2:
![]()
The magnitude of KD indicates a strong affinity of the liposomes for paclitaxel, affinity that is close to the strength of ligand-receptor interactions. Previous studies have found a distribution constant of 9.4·103 for paclitaxel partitioning into lipid bilayers based on 1‑palmitoyl-2-oleoyl-glycero-3-phosphocholine (7).
Apparently, the currently investigated liposomes possess a much higher distribution constant for paclitaxel.
CONCLUSION
This investigation presented an isocratic reversed-phase HPLC assay for free paclitaxel in a liposome formulation, using a membrane-protected SPME technique for sample preparation. Separation of water-dissolved paclitaxel from liposome-bound paclitaxel was successfully achieved with a dialysis membrane. With the help of a CW/TPR coating, extraction of paclitaxel from the inner opening of the cylindrical membrane was performed simultaneously with the separation process. The method was faster and more practical than equilibrium dialysis, as the SPME approach provided pre‑concentration and convenient delivery to the analytical system.
Even though the liposomes contain a high concentration of paclitaxel, the aqueous solution in contact with the liposomes contains a low concentration of paclitaxel, significantly below the solubility limit. The distribution constant of paclitaxel between liposomes and water is approximately 30 times higher than in the case of previously developed lipid-based vesicles (7). These findings support the use of liposomes as an efficient vehicle system for paclitaxel and propose membrane-protected SPME as a valuable tool for the determination of free concentrations in complex samples.