J Pharm Pharmaceut Sci
(www.cspscanada.org) 8(3):374-386, 2005
Preparative Enzymatic Synthesis and HPLC Analysis of
Rhapontigenin: Applications to Metabolism, Pharmacokinetics and Anti-Cancer
Studies
Kathryn
A. Roupe1, 2, Greg L. Helms3, 4, Steven C. Halls3, 5,
Jaime A. Yáñez1, 2, Neal M. Davies1,2, 6, 7
1Pharmacology
and Toxicology Graduate Program, 2Department of Pharmaceutical 3Sciences,
Department of Chemistry, 4Center for NMR Spectroscopy, 5Mass Spectrometry
Center,
6Cancer
Prevention and Research Center, 7Center for Integrated
Biotechnology, College of Pharmacy, Washington State University, Pullman,
Washington, USA
Received April 13,
2005; Revised June 14, 2005; Accepted June 28, 2005; Published August 22, 2005
PDF
Version
Corresponding author: Dr. Neal M Davies, College of Pharmacy,
Department of Pharmaceutical Sciences, Washington
State University,
Pullman, Washington,
USA,
99164-6534.
ndavies@wsu.edu
ABSTRACT
Purpose: A facile method was established to enzymatically synthesize
rhapontigenin from the glycosylated parent compound rhaponticin. A novel and
simple high-performance liquid chromatographic method was developed for the
determination of rhapontigenin. The assay was successfully applied to both the in vitro and in vivo metabolic
kinetic study of rhapontigenin. Methods: Serum, or microsomes (0.1 mL) was
precipitated with acetonitrile after addition of the internal standard,
daidzein. Separation was achieved on an amylose tris
3,5 dimethylphenylcarbamate column (150 x 4.6mm, ID, 5μm) with UV
detection at 324nm. Hep G2 hepatoma cells were treated with rhapontigenin or
rhaponticin (0-250 μg/mL) and cell viability was measured. Results:
The calibration curves were linear ranging from 0.5 to 100 mg/mL. The mean
extraction efficiency was > 99%. Precision of the assay (coefficient of
variation) was <5%, including the limit of quantitation (0.5 μg/mL).
Bias of the assay was lower than 5%. The limit of detection was 100 ng/mL for a
0.1 mL sample. One glucuronidated metabolite of rhapontigenin has been identified.
Preliminary pharmacokinetic data revealed the presence of a glucuronidated
metabolite in the serum and a terminal elimination t1/2 of ~6h.
Rhapontigenin demonstrated concentration-dependent anti-cancer activity with an
IC50 115 μg/mL in HEP G2 cells while rhaponticin showed no
activity across the concentrations tested in vitro. Conclusions:
The preparative enzymatic synthesis method has demonstrated utility to
provide sufficient rhapontigenin for pharmaceutical studies. Rhapontigenin is
an active anti-cancer compound. The developed HPLC assay is sensitive,
reproducible and accurate and can be applied to pharmacokinetic and metabolism
studies.
INTRODUCTION
Rhapontigenin, (3, 3’, 5 –trihydroxy-4’-methoxy-stilbene)
C15H16O4, MW: 258 [Table 1], is a stilbene
found in Korean rhubarb rhizomes, and is most abundant in the Rhei undulatum
species [1]. Rhaponticin, the
glycosylated parent compound of rhapontigenin has long been employed in Korea,
Japan, and China as an oral haemostatic agent in treating Oketsu, a disease
characterized by poor circulation, pain, and chronic inflammation [2] [Table
1]. Rhaponticin has also been recommended by health professionals in Asian
countries to treat and prevent allergies [3]. Rhapontigenin, the aglycone of
rhaponticin, has been suggested to be the active molecule [3, 4, 5]. Recent research has shown rhapontigenin to be a
potent anti-allergic, anti-coagulant, and anti-inflammatory compound [6-8].
Rhapontigenin
is structurally similar to the anti-cancer stilbene resveratrol, which is
present in red wine [9]. Considerable scientific studies have demonstrated
potent anti-cancer activity of resveratrol across many cancer cell lines [9].
Given the similarity in structure of resveratrol [Table 1], it is possible that
rhapontigenin also possesses potent anti-cancer activity. Recent investigation
has found rhapontigenin to be a potent inhibitor of the human cytochrome P450
1A1 enzyme, which is implicated in the biotransformation of a number of
carcinogenic and immunotoxic compounds [10].
Additionally, rhapontigenin has been shown to be an inhibitor of CYP
1B1, an enzyme that is expressed and detected in a number of cancers such as
prostate and breast cancers [11].
Although used in traditional Asian
medicine, rhapontigenin has not been thoroughly investigated
pharmaceutically. This is likely due to
the fact that it is not yet commercially available for purchase from chemical
companies. In order to elucidate the metabolism kinetics of rhapontigenin,
knowledge of its metabolic pathways in biological fluids is of considerable
importance. To our knowledge, no study has been published characterizing the in
vitro metabolism of rhapontigenin, and there is no pharmacokinetic
information or validated assays to measure rhapontigenin described in the
literature. Before performing studies of biotransformation, a facile method of
producing pure rhapontigenin is necessary and development of a selective and
sensitive assay for rhapontigenin is needed. The present study describes a
simple method of enzymatic synthesis of rhapontigenin from commercially
available rhaponticin. Furthermore, a selective, isocratic reversed-phase HPLC
method for the determination of rhapontigenin and its metabolites in rat serum
and its application to in vitro and in vivo kinetic studies is detailed.
EXPERIMENTAL
Chemicals and reagents
Daidizen, halothane, rhaponticin, β-glucosidase
from almonds, total protein reagent, protein standard solution, monosodium
glucose-6-phosphate, tetraethylammonium acetate tetrahydrate, b-nicotinamide
adenine dinucleotide phosphate (b-NADP) sodium salt hydrate, and
glucose-6-phosphate dehydrogenase, Trypsin-EDTA, Trypan blue,
phosphate-buffered saline (PBS), resazurin, sodium bicarbonate,
penicillin-streptomycin, and insulin were purchased from Sigma (St. Louis, MO,
USA). HPLC grade methanol, reagent alcohol, acetonitrile, and water were
purchased from J. T. Baker (Phillipsburg,
NJ, USA).
Solid phase extraction (SPE) C-18 columns were purchased from Cayman Chemical
Company (Ann Arbor, MI, USA). Dulbecco’s Modified Eagle Medium (D-MEM) and
RMPI 1640 medium were purchased from Gibco Industries Inc. (Langley, OK, USA). Fetal bovine serum (FBS) was
purchased form Equitech-Bio Inc. (Kerrville,
TX, USA).
Chromatographic system and
conditions
The
HPLC system used was a Shimadzu HPLC (Kyoto, Japan), consisting of an LC-10AT
pump, a SIL-10AF auto injector, a photodiode-array SPD-10A
VP UV/VIS spectrophotometric detector and an SCL-10A system controller.
Injection volume was 150 μL. Data collection and integration were
accomplished using Shimadzu EZ start 7.1.1 program software.
The
analytical column used was an amylose tris 3, 5
dimethylphenylcarbamate (150 ´ 4.6 mm, ID, 5 mm) (Chiral Technologies Inc. Exton, PA, USA). The mobile phase consisted of acetonitrile
and 0.1% phosphoric acid (30:70, v/v), filtered and degassed under reduced
pressure prior to use. Separation was carried out isocratically at ambient
temperature, and a flow rate of 1.0 mL/min, with UV detection at 324 nm.
Mass Spectrometry Conditions
Samples were applied to an API 4000 triple quadrupole
mass spectrometer (Applied Biosystems Sciex, ON, Canada) using negative ion
electrospray under similar chromatographic conditions to those mentioned above
with the exceptions that an Agilent 1100 series HPLC system (Palo Alto, CA,
USA) was employed, consisting of: autosampler, binary pump, degasser, and UV
detector and phosphoric acid was omitted as a modifier while 1 mM (NH4)HCO3
was used to maintain neutral pH.
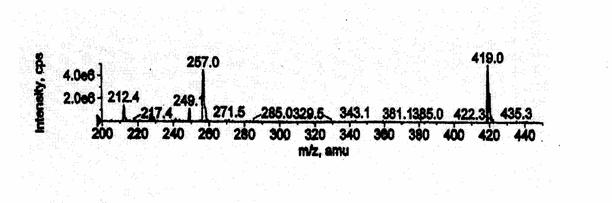
The mass spectrometer was operated under conditions optimized for
rhapontigenin at the chromatographic flow conditions (0.5 mL min-1)
as follows: The Ionspray needle was
maintained at -4500 kV, with nitrogen as drying gas 1 (setting 40), drying gas
2 (setting 25), curtain gas (setting 10), and collision gas (setting 4). The turbospray interface was maintained at
400 °C. The
declustering potential (DP), collision energy (CE), and exit potential (EP)
were optimum at 30 V, 45 eV and 10 V, respectively. Both the Q1 and Q3 quadrupoles were
maintained at unit resolution (0.7 Da width at half height). The characteristic fragmentation reactions
include m/z 257 for rhapontigenin and m/z 419 for rhapontigenin glucuronide.
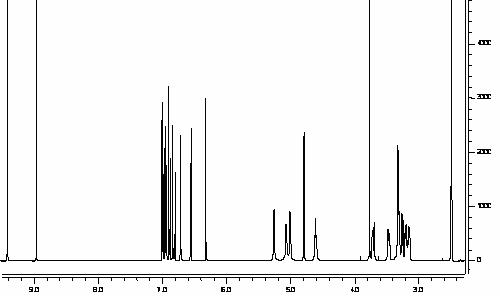
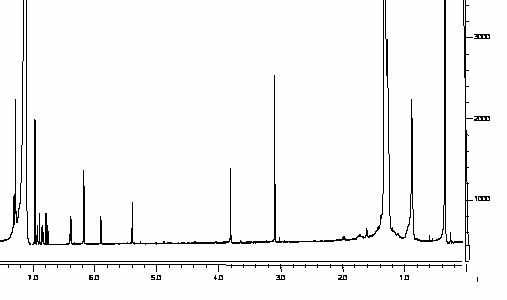
Nuclear Magnetic Resonance (NMR) Conditions
1H NMR (499.85 MHz), 13C NMR
(125.67 MHz) spectroscopic analyses were carried out on a Varian Inova 500 MHz spectrometer. Proton spectra of rhaponticin (6 mg in 700 µl
DMSO-d6) were collected at 22 oC and referenced to the
residual proton signal at 2.49 ppm, whereas the 13C spectra were
referenced to the solvent signal at 39.5 ppm.
Proton spectra of rhapontigenin were obtained in benzene-d6
at 22 oC and were referenced to the residual proton signal at 7.15
ppm. The
phenolic OH protons were in fast exchange with the bulk water in the benzene-d6
solution and hence appear at the bulk water chemical shift which is a 1.35 ppm.
A gradient enhanced phase-sensitive 1H-13C
HSQC spectrum was obtained for rhaponticin using the standard Varian pulse
sequence and was collected with sweep widths (acquisition times) of 4,614 Hz
(222 ms) in t2 (1H) and 16967 Hz (15.1 ms, 256 x 2 hypercomplex
increments) in t1 (13C). The
data were then processed in F2 by applying a Gaussian function with a 0.101 s
time constant prior to Fourier transformation.
The F1 processed data utilized a linear prediction of the original 256
real points to 512 points, apodizing with a Gaussian function using a 0.026 s
time constant, zero filling to 2K complex points and followed by Fourier
transformation. A gradient selected 1H-13C
HMBC was also acquired for rhapontigenin using the standard Varian pulse
sequence and was collected with sweep widths (acquisition times) of 4,614 Hz
(222 ms) in t2 (1H) and 16214 Hz (24.7 ms, 400 increments) in t1 (13C). The data were processed in F2 and F1 by
applying a sine-bell function prior to Fourier transformation. The data in F1 was extended to 800 real
points by linear prediction, zero filled to 4096 points and Fourier
transformed.
Enzymatic Synthesis of Rhapontigenin
A 0.01M tetraethylammonium acetate buffer was made by
adding 261 mg tetraethylammonium acetate to 100 mL HPLC water in a volumetric
flask. The pH was adjusted to 5.0 using 1M HCL. 4 mL buffer was filtered and
added to a clean glass test tube. 20 mg rhaponticin was weighed carefully and
added to the prepared buffer. The rhaponticin solution was sonicated and
vortexed until dissolved. The rhaponticin solution was then placed in a 37 oC
shaking water bath. Next, an enzyme solution was prepared by adding 1 mL buffer
to 6 mg β-glucosidase. The enzyme solution was shaken gently and directly
added to the rhaponticin solution. The resulting solution was incubated for 72
hours. 200 μL aliquots of the incubate were taken every 24 hours and the
reaction progression was monitored via HPLC [Figure 1].
The
final incubate was transferred to a solid phase extraction C-18 column and the
eluted solution was collected in a test tube. The SPE column was washed with
HPLC water and the aqueous fraction was collected in a separate test tube.
Finally, the SPE column was eluted with 2 mL methanol and the methanol fraction
was collected in a glass test tube and dried under a gentle stream of nitrogen
gas. The resulting powder was weighed, transferred to a screw top glass vial
and stored at 4oC. The
successful enzymatic synthesis of rhapontigenin was verified by NMR and mass
spectrometry with an m/z ratio of 256.6 and a fragmentation pattern
consistent with rhapontigenin [Table 2-3
Figures 2-4].
Figure 1:. HPLC-monitored enzymatic reaction of
rhaponticin into rhapontigenin via β-glucosidase.
The melting point of the newly synthesized rhapontigenin
was determined employing a Thomas Hoover Capillary Melting Point Apparatus®
(Arthur H. Thomas Company, Philadelphia,
PA, USA).
The heat setting was set at 3.9 and the temperature was ramped at 1.0 oC/
minute. Visual determination of the melting point showed the uncorrected onset
temperature to be 182.0 oC and the end point to be 184.0 oC.
Stock and
Working Standard Solutions
Methanolic stock solutions of
rhapontigenin (1 mg/mL) and daidzein (1 mg/mL) were prepared. The daidzein
solution was subsequently diluted with methanol to make a working internal
standard (IS) solution of 10 µg/mL. These solutions were protected from light
and stored at -20 °C between uses, for no
longer than 3 months. Calibration standards in serum were prepared daily from
the stock solution of rhapontigenin by sequential dilution with blank rat
serum, yielding a series of concentrations namely 0.5, 1.0, 5.0, 10.0, 50.0,
100.0 mg/mL), in four replicates.
|
Table 2: H’NMR values for Rhapontigenin:
(Benzene-d6)
|
|
OH
|
Exchanging with Benzene-d6
|
|
H2
|
6.18
|
|
H4
|
5.40
|
|
H6
|
6.18
|
|
Hα
|
6.77
|
|
Hβ
|
6.90
|
|
H2’
|
6.85
|
|
H3’
|
6.39
|
|
OCH3’
|
3.10
|
|
H6’
|
5.91
|
Quality
control (QC) samples were prepared from the stock solution of rhapontigenin by
dilution with blank rat serum to yield target concentrations of 0.5, 1.0, 5.0,
10.0, 50.0 and 100.0 µg/mL. The QC samples were divided into 0.5 mL aliquots in
screw-capped test tubes and stored at -20 °C before use.
Sample preparation
0.1 mL of internal standard solution (10 µg/mL) was
added to working standards or samples (0.1 mL). The mixture was precipitated
with 1.0 mL ice-cold acetonitrile and was centrifuged at 8,000 x g for 5 min
using Beckman microfuge. Following
transfer of the supernatant to new vials, the residue was placed in sample
vials 150 µL of the supernatant was injected onto the column.
Precision and accuracy
The within-run precision and accuracy of the replicate
assays (n=6) were tested by using six
different concentrations, namely 0.5, 1, 5, 10, 50 and 100 mg/mL. The
between-run precision and accuracy of the assays were estimated from the
results of six replicate assays of QC samples of six different days within one
week. The precision was evaluated by calculating the coefficient of variation
(CV) using ANOVA. The accuracy was estimated based on the mean percentage error
of measured concentration to the actual concentration. The values of CV and
bias were within 15%, at all concentrations tested [12].
Recovery
Recovery of rhapontigenin from rat serum was assessed
(n=6) at 0.5, 1.0, 5, 10, 50, 100 mg/mL. A known amount of rhapontigenin was
spiked into 0.1 mL rat serum to give the above concentrations. The proteins
present in the serum were precipitated with 1mL ice-cold acetonitrile and the
supernatant was analysed by HPLC following centrifugation at 8,000 x g for 5
min. The extraction efficiency was
determin ed by comparing the peak area ratio (PAR)
of rhapontigenin to IS in the serum matrix to that in water.
Stability of Rhapontigenin
Samples
The stability of rhapontigenin samples were assessed
under five different conditions. The stability of rhapontigenin in rat serum at
room temperature (22 ± 1 ºC) and at –20 ºC was investigated using
QC samples of five concentration levels, 1, 5, 10 mg/mL in four replicates.
The
freeze-thaw stability of rhapontigenin was evaluated at three concentrations 1,
5, and 10 mg/mL, using QC samples. These samples
were analyzed in
triplicate without freezing, and then stored at –20
°C and thawed at room temperature (22
± 1 ºC) for
three cycles.
Table
3: 1H’NMR and 13C’NMR
for Rhaponticin: (DMSO-d6)
|
C1
|
138.99
|
|
|
|
C2
|
100.52
|
H2
|
4.79
|
|
C3
|
158.67
|
|
|
|
C4
|
102.77
|
H4
|
6.33
|
|
C5
|
158.14
|
OH5
|
9.44
|
|
C6
|
107.12
|
H6
|
6.57
|
|
Cα
|
125.93
|
Hα
|
6.83
|
|
Cβ
|
128.29
|
Hβ
|
6.98
|
|
C1’
|
129.83
|
|
|
|
C2’
|
112.83
|
H2’
|
7.01
|
|
C3’
|
146.39
|
3’-OH
|
8.97
|
|
C4’
|
147.54
|
|
|
|
4’-OCH3
|
55.59
|
4’-OCH3
|
3.77
|
|
C5’
|
111.95
|
H5’
|
6.89
|
|
C6’
|
118.43
|
H6’
|
6.95
|
|
Glucose Ring
Assignments:
|
|
|
C1’’
|
100.50
|
H1’’
|
4.79
|
|
C2’’
|
73.21
|
H2’’
|
3.19 2’’-OH
5.26
|
|
C3’’
|
76.62
|
H3’’
|
3.25 3’’-OH
5.07
|
|
C4’’
|
69.69
|
H4’’
|
3.14 4’’-OH
5.01
|
|
C5’’
|
77.04
|
H5’’
|
3.30
|
|
C6’’
|
60.65
|
H6’’a
|
3.46 H6’’b
3.70 6’’-OH 4.61
|
The
stability of rhapontigenin in reconstituted extracts during run-time in the
HPLC auto-injector was investigated, using pooled extracts from QC samples of
three concentration levels, 1, 5, 10 mg/mL.
Samples were kept in the sample rack of the auto-injector and injected
into HPLC system every 6h, from 0 - 24 h, at the temperature of auto-injector
(26 ± 1 °C).
The
stability of reconstituted extracts was also tested at –20 °C for one week. The reconstituted extracts of six
concentrations, 0.5, 1, 5, 10, 50 and 100 mg/mL were allocated in injection vials,
stored at –20 °C and injected onto the column on day 0 and day 1.
The
stability of reconstituted extracts was also tested at –20 °C for one
day. The reconstituted extracts of six
concentrations, 0.5, 1, 5, 10, 50 and 100 mg/mL were allocated in injection vials,
stored at –20 °C and injected onto the column on day 0 and day 1.
The
light stability of rhapontigenin in stock solution was also tested at room
temperature for one day. Samples were exposed to laboratory (fluorescent
overhead) illumination for up to 24 hours and injected onto the column from
time 0 to 24 h post illumination.
Stability of Rhapontigenin in
Rat Serum
Rhapontigenin was incubated in rat serum at 37.0 ± 0.1 °C in a
thermostatically controlled shaking water bath. Prior to the kinetic study, the
incubation media were equilibrated to the temperature of the study. Kinetic
studies were initiated by the addition of a stock solution of rhapontigenin to
incubation media, yielding an initial concentration of 10 mg/mL. At
pre-determined time intervals, samples (0.5 mL) were removed and the reaction
was stopped by adding equal volume of ice-cold acetonitrile and mixing immediately.
Samples were analysed by HPLC following centrifugation at 8,000x g for 5 min
using Beckman microfuge.
Pharmacokinetics
Male Sprague Dawley rats (n=3, 300-325 g, Harlan, Indianapolis, IN,
USA) were
anaesthetized using halothane and a silastic catheter was cannulated into the
right jugular vein. The animals were
placed in metabolic cages, allowed to recover overnight and fasted for 12 h
before dosing. On the day of experiment, the animals were dosed intravenously
with an IV dosing solution of rhapontigenin (10 mg/kg) in 5% dimethyl sulfoxide
(DMSO) and polyethylene glycol 400 (PEG-400). Serial blood samples (0.25 mL)
were collected at 0, 1 min, 10 min, 0.25, 0.5, 1, 2, 4, 6, 12 and 24 h. After
each sample collection, the cannulas were flushed with 0.25 mL of saline.
Following centrifugation of the blood samples, serum was collected and stored
at –70 °C until analysed. The experimental animal protocols
were approved by the Institutional Animal Care and Use Committee of Washington
State University.
Rat Liver Microsomes Preparation
Male rat liver microsomes were prepared from adult
male Sprague-Dawley rats using previously published procedures [13,14]. The
fresh rat livers were cut from euthanized rats and put into ice-cold
saline, weighed, and minced. Samples were homogenized using a motorized
homogenizer (four strokes) in ice-cold homogenization buffer
(50 mM pH 7.4 potassium phosphate buffer, 250 mM sucrose, 1 mM
EDTA) and centrifuged at 7700 x g for 15 min at 4 °C. The
supernatant collected was then centrifuged again at 18,500 x g
for 15 min at 4 °C. After the pellet was discarded, the
supernatant was centrifuged again at 85,600 x g for
1.0 h at 4 °C to yield microsome pellets. The microsomes were
resuspended in microsome washing buffer (10 mM pH 7.4 potassium
phosphate buffer, 0.1 mM EDTA, and 150 mM KCl) and
centrifuged again at 85,600 x g for 1.0 h at 4 °C to yield microsomes.
The microsome pellet was then resuspended in 250 mM sucrose,
aliquoted into vials (0.5 mL/vial), and stored at -80 °C until
use.
Microsome Protein Concentration
Protein concentration of microsomal protein was
determined using a protein assay (Bio-Rad, Hercules, CA, USA), using bovine serum albumin
as standard.
Phase I Metabolism
Studies of metabolic kinetics of rhapontigenin were
conducted in the presence of cofactors which included 10 mM MgCl2
and an NADPH-generating system (7.5 mM glucose 6-phosphate, 0.3 mM b-NADP and 0.42
unit/mL glucose-6-phosphate dehydrogenase), in 100 mM phosphate buffer
containing 1 mM EDTA (pH 7.4) under carbogen gas at 37.0 ± 0.1 °C in a shaking
(75 rpm) water bath. The parent drug was added as a methanolic stock solution
of 1.0 mg/mL (at a volume of 0.5% in the final incubation mixtures) and was
pre-incubated in the incubation buffer for 5 min at 37 ± 0.1 °C. The reaction was initiated by adding the
cofactors. At pre-determined time intervals, samples (0.5 mL each) were
withdrawn and the reaction was terminated immediately by adding 50 µL of
94% acetonitrile/ 6% glacial acetic acid. Samples were then
extracted and analysed by HPLC.
Phase II Metabolism
The incubation procedures for measuring uridine
diphosphate-glucuronosyltransferase (UGT) activities using microsomes were as
follows: 1) Microsome (final concentration ~0.05 mg protein/ml) was
mixed with each of the following: MgCl2 (0.88 mM),
saccharolactone (4.4 mM), and alamethicin (0.022 mg/ml).
42 μM of rhapontigenin in a 50 mM potassium phosphate
buffer (pH 7.4) was added as the substrate and finally uridine
diphosphoglucuronic acid (3.5 mM) was added to activate the reaction. 2)
The mixture was incubated at 37 °C for 10, 20, 30, or 60 min; and 3). The
reaction was stopped by the addition of 50 µL of 94% acetonitrile/6%
glacial acetic acid.
Cell Culture
Hep-G2 (human hepatoma) cell line was obtained from
the American Type Culture Association (ATCC, Rockville, MD.)
and maintained in Dulbecco’s Modified Eagle Medium (D-MEM). The Cell line was
supplemented with 10% heat-inactivated fetal bovine serum (FBS),
penicillin-streptomycin (10mg/1L) insulin (4mg/mL) and was incubated at 37oC
in a 5% CO2 atmosphere.
Cell Number
The optimal cell seeding numbers for each cell line
was determined by preliminary cell seeding number experiments. Cells were
seeded in numbers 1 x 10⁴, 2 x 10⁴, 3 x 10⁴
and so on until the final cell seeding number 1 x 10⁵ per well in a
96 well plate (Costar 3595). Cell plates were incubated at 37oC in a
5% CO2 atmosphere for 72 hours. Following incubation, medium was
aspirated and alamar blue (resazurin) fluorescent dye solution was diluted in
fresh medium to make a 10% resazurin solution. The 10% solution was added
directly to cells. The cell plates were incubated at 37oC in a 5% CO2
atmosphere for 3 hours. The cell plates were subsequently removed from the
incubator and placed at room temperature in a darkened drawer to protect from
light for 30 minutes. Next, the cell plates were placed into the Cytoflour®4000
fluorescence multi-well plate reader (Applied Biosystems, USA).
Fluorescence was read at an excitation of 485 nm and an emission of 530 nm.
Standard curves of cell seeding number against fluorescence were generated. Hep
G2 cells were seeded at a density of 5000 cells/well.
Alamar Blue Assay
Alamar Blue (resazurin) fluorescent dye is a facile
and accurate assay that has recently gained scientific popularity in
determining the cytotoxicity of many cell lines [15]. The resazurin
non-fluorescent compound is metabolised into the fluorescent compound resorufin
by intact and viable cells. This
emission of fluorescence can be quantified using a cell plate reader and the
number of viable cells following treatment can be determined. Cells were
counted and seeded on 96 well plates. The seeded cells were incubated at
37oC in a 5% CO2 atmosphere for 24 hours. Rhaponticin and
rhapontigenin were dissolved in methanol the day of the experiment and were
diluted in medium to yield concentrations of 0.1, 1, 10, 50, and 100 μg/mL. Following aspiration of the medium, cells
were treated with the stilbene solutions. Additional cells were treated with
either methanol diluted in medium or medium only. Treated and control cells
were incubated at 37oC in a 5% CO2 atmosphere for 72 hours.
After cell plates were removed from the incubator, medium was aspirated and
replaced with 10% alamar blue (resazurin) fluorescent dye diluted in fresh
medium. Cell plates were incubated at 37oC in a 5% CO2
atmosphere for an additional 3 hours. Following incubation, cell plates were
placed in a darkened environment for 30 minutes at room temperature. Next, the
cell plates were placed into the Cytoflour®4000 fluorescence multi-well plate
reader (Applied Biosystems, USA).
Fluorescence was read at an excitation of 485 nm and an emission of 530 nm. The
viable cell number (as a percent of control) in each cell line exposed to
varying concentrations of stilbene was measured.
Data analysis
Rhapontigenin was identified with and without
β-glucuronidase by its retention time relative to the internal standard
(IS) on HPLC chromatograms. Quantification was based on calibration curves
constructed using the peak area ratio (PAR) of rhapontigenin to (IS), against
rhapontigenin concentrations using unweighted least squares linear regression.
The percentage of metabolism products was estimated as the ratio of PAR of
metabolite to PAR of patent drug at time zero. The apparent decomposition rate
constants (kapp) were
estimated from the slope of log-linear phase of declining concentration versus
time plots. The half-lives (t½)
were calculated using the following equation: t½ = 0.693/ kapp.
Data were expressed as the mean ± standard deviation (SD) of replicate
determinations. Pharmacokinetic parameters were estimated using WinNonlin®
(version 1.0).
RESULTS
Chromatography
There were no interfering peaks co-eluted with the compounds
of interest (Figure 5). Separation of rhapontigenin and the internal standard
in rat serum were achieved successfully. The retention times of rhapontigenin
and IS were approximately 22 min and 16 minutes, respectively (Figure 6).
The performance of the HPLC assay was
assessed using the following parameters, namely peak shape and purity,
interference from endogenous substances in rat serum, linearity, limit of
quantitation (LOQ), limit of detection (LOD), freeze-thaw stability, stability
of reconstituted extracts, precision, accuracy and recovery. Various conditions
of HPLC were tested to achieve the best resolution of rhapontigenin. The retention
times of analytes were found to be very sensitive to the percentage of
acetonitrile in the mobile phase. The optimal separation was achieved when the
combination of acetonitrile and phosphoric acid was 30:70 (v/v) and the flow
rate was 1.0 ml/min.
Based
on spectrophotometer analysis of rhapontigenin reconstituted in mobile phase
prior to HPLC analysis, UV detection was set at 324 nm.
Linearity, LOQ and LOD
An excellent linear relationship (r2 = 0.998) was demonstrated
between peak area ratio (PAR) of rhapontigenin to IS and the corresponding
serum concentrations of rhapontigenin over a range of 0.5 to 100 mg/mL.
Figure 5: Blank rat serum demonstrating no
interfering peaks co-eluted with the compounds of interest.
Figure 6: Rat
serum containing daidzein (internal standard) and rhapontigenin with at a
concentration of 10 mg/mL.
The
mean regression line from the validation runs was described by rhapontigenin mg/mL= Peak
area ratio x 1.4366+2.2237. The LOQ of this assay was 0.5 mg/mL in rat
serum with the corresponding relative standard deviation and bias of 0.83 and
8.8%, respectively. This calibration curve was cross-validated with QC samples
of rhapontigenin in microsomes. The back-calculated concentration of QC samples
in these matrices was within the acceptance criteria. The LOD of rhapontigenin
was estimated to be 0.1 mg/mL in rat.
Precision, Accuracy and
Recovery
The within- and between-run CV calculated during
replicate assays (n=6) of
rhapontigenin in rat serum were <5% over a wide range of rhapontigenin
concentrations. The intra- and inter-run bias assessed during replicate assays
varied between –4.7 and 14.6%. Precision
and accuracy studies indicated that the developed HPLC method is reproducible
and accurate. The mean extraction efficiency for rhapontigenin from rat serum
varied from 99 to 100.2%. High recovery of rhapontigenin from rat serum
suggested that there was negligible loss during the protein precipitation
process, and the efficiencies of extraction of rhapontigenin and IS were
comparable.
Stability of Rhapontigenin
Samples
No significant degradation was detected after the
samples of rhapontigenin in rat serum were stored at room temperature for 3 h,
or in a freezer at or below –20 °C for 4 weeks, or after undergoing one
freeze-thaw cycle. Under ambient conditions for 3 h, there was > 99% of
rhapontigenin recovered across concentrations. When stored in a freezer at –20 °C, recoveries
of rhapontigenin were >99% after 1 and 4 weeks. The recoveries were >95%
following three freeze-thaw cycles in all concentrations tested (1 μg/mL,
5 μg/mL, and 10 μg/mL). There
was no significant decomposition observed after the reconstituted extracts of
rhapontigenin were stored in the auto-injector at room temperature for 24 h or
in freezer at –20 °C for 1 week. The measurements were >99% of the
initial values for all concentrations during the storage in the auto injector
at room temperature for 24 h. When
stored in a freezer at –20 °C, the recovery was >99% within one week
at all concentrations investigated.
Metabolism of Rhapontigenin in
Rat Liver Microsomes under a NADPH Generating System
The HPLC method has been applied to the determination
of rhapontigenin and its metabolic products in the Phase I metabolic kinetic
study of rhapontigenin in rat liver microsomes.
Rhapontigenin was added individually to microsomes in a concentration of
10 mg/mL. Following the incubation of rhapontigenin as
parent
drug at 37 °C in rat liver
microsomes with an NADPH generating system, no observable peaks were detected
and no decrease in parent rhapontigenin was evident, suggesting no appreciative
oxidative metabolism is apparent.
Pharmacokinetics of Rhapontigenin in Rats
The HPLC method has been applied to the determination
of rhapontigenin in pharmacokinetic studies in rats. There are no previously
published studies or information of the pharmacokinetics of rhapontigenin in
any species. Following administration of rhapontigenin there was an apparent
terminal elimination half-life of ~6h for the parent compound [Figure 7].
Figure 7: Mean
intravenous pharmacokinetics of rhapontigenin in male Sprague Dawley rats (n=3).
One
previously unidentified metabolite was detected with a retention time of 4
minutes in the solvent front. The metabolite was measured indirectly by
treating samples with β-glucuronidase and measuring the increase in parent
compound. The metabolite was isolated and the m/z ratio and fragmentation pattern was determined using mass
spectrometry. The metabolite was shown to have an m/z ratio of
419 and a fragmentation pattern that is consistent with glucuronidation [Figure
8]. The pharmacokinetics of rhapontigenin appears to be qualitatively very
similar to previous reports of resveratrol in the rat where a glucuronide
metabolite is also present in plasma [19].
Metabolism of Rhapontigenin in
Rat Liver Microsomes under a UGT Generating System
The HPLC method has been applied to the determination
of rhapontigenin and its metabolic products in the phase II metabolic kinetic
study of rhapontigenin in rat liver microsomes.
Rhapontigenin was added individually to microsomes in a concentration of
10 mg/mL. Following the incubation of rhapontigenin as
parent drug at 37 °C in rat liver microsomes with the UGT enzyme, a rapid
and significant decrease in rhapontigenin was detected. A metabolic peak was
observed, eluting at 4 minutes, which could not be resolved from the solvent
front. The amount of this metabolite detected increased over time coinciding
with the reduction of parent rhapontigenin [Figure 9].
This suggests that extensive glucuronidative
metabolism is apparent, which was confirmed by mass spectrometry analysis. The
glucuronidated metabolite had an m/z ratio of 419 and a fragmentation
pattern consistent with glucuronidation. Due to the fact that the metabolite
eluted with the solvent front, the quantification
of metabolite was determined indirectly
using β-glucuronidase to hydrolyze the metabolite
back to
parent compound. This technique has been extensively
used in metabolism and pharmacokinetic research to determine metabolite
concentration over time [16, 17, 18].
β-glucuronidase was added to a set of microsomal samples instead of
acetic acid/acetonitrile stop solution. These samples were analyzed via HPLC
along side of original microsomal samples exposed to the stop solution. HPLC
analysis confirmed the absence of the glucuronidated metabolite. This same peak
at the same retention time was also apparent in the rat serum
Figure 9: Phase II
Microsomal metabolism of Rhapontigenin in rat liver microsome.
.
Anti-cancer Activity of Rhaponticin and Rhapontigenin
in Hep-G2 Cells.
The anti-cancer activities of rhaponticin and
rhapontigenin were tested in the Hep-G2 hepatoma cell line. Analysis of cell
viability as a percent of the control following exposure showed greater
activity in cells treated with rhapontigenin compared to the parent compound
rhaponticin. At the highest concentration tested (250 μg/mL), the viable
number of cells detected was 10% of that of the control. Comparatively,
rhaponticin showed little pharmacological activity [Figure 10]. The IC50
of rhapontigenin in the Hep-G2 cell line was determined by pharmacodynamic
modeling using WinNonlin® (version 1.0) and was determined to be 115.0±49.3 μg/mL.
DISCUSSION
Rhapontigenin is a stilbenoid compound that has been
shown to be an active anti-allergenic, anti-inflammatory and anti-cancer agent.
Recent investigation has found rhapontigenin to be a potent inhibitor of human
cytochrome P450 1A1 enzyme. This enzyme is implicated in the biotransformation
of a number of carcinogenic and immunotoxic compounds. In addition to potently
inhibiting P450 1A1, rhapontigenin is also an inhibitor of CYP 1B1. This enzyme
is expressed and detected in a number of cancers such as prostate and breast
cancers. These data demonstrating the
possible anti-cancer activity of rhapontigenin illustrates the necessity for
further characterization, testing, and development of this compound. However,
rhapontigenin is not commercially available and a facile method for its
synthesis is imperative in order to develop an assay for its quantification as
well as to further study its pharmacological properties. This current research describes a novel method
for the enzymatic synthesis of rhapontigenin from its glycosylated parent
compound rhaponticin. Moreover, the development and validation of this HPLC
assay methodology is described and its applicability to the study of
pharmacokinetics, metabolism and anti-cancer activity of rhapontigenin has been
demonstrated.
Our metabolism data shows that rhapontigenin is
extensively glucuronidated. This same pattern of metabolism has been
demonstrated for other structurally similar stilbene compounds namely
piceatannol, pinosylvin, and resveratrol [Table 1] [16-19] in which the
glucuronidated metabolite is extensive and present in both in vivo male
rat serum samples and in in vitro male rat liver microsomal fractions.
In addition, the preliminary pharmacokinetic characterization of rhapontigenin
appears to be very similar to those of piceatannol, pinosylvin, and
resveratrol.
Figure 10: Anti-cancer activity of Rhaponticin and
Rhapontigenin in Hep-G2 cells.
Our data from the
alamar blue assay, which measured Hep G2 hepatoma cell viability following treatment
with rhapontigenin and rhaponticin, demonstrated that rhapontigenin possesses anti-cancer
activity with an IC50 115.0±49.3 μg/mL. Comparatively,
rhaponticin showed insignificant activity. This data further supports the
concept that rhapontigenin is the active molecule compared to its glycosylated
parent compound, rhaponticin, and that rhaponticin must be biotransformed into
rhapontigenin to elicit anti-cancer activity.
CONCLUSIONS
In summary, the developed enzymatic synthesis method
for rhapontigenin is facile and facilitates preparative rhapontigenin
production and may have utility for preparation and purification of other stilbene
and flavonoid glycosylates to be resolved into their respective aglycones. The
developed HPLC assay is sensitive, reproducible, accurate and specific. It has
been successfully applied to the preliminary study of pharmacokinetics and
metabolism of rhapontigenin in rats and is the first report of these
pharmacometric properties in any species. Using this HPLC method, large numbers
of biological samples can be analyzed in a relatively short period of time.
Further studies are ongoing in our laboratory to further characterize the
pharmacokinetics and metabolites of rhapontigenin and other stilbenes as well
as their pharmacological and toxicological activities.
ACKNOWLEDGEMENTS
The authors would like to thank the Monroe Mullen
Fellowship awarded to KAR, Dr. Rob Ronald for helping to determine the melting
point of rhapontigenin, and a grant from the Organic Center
for Education and Promotion to NMD.
REFERENCES
- Ko SW, Lee
SM, Whang WK. Anti-platelet aggregation activity on stilbene derivatives from Rheum
undulatum. Arch Pharm Res, 22:401-403, 1999.
- Matsuda H,
Kageura T, Morikawa T, Toguchida I, Harima S, Yoshikawa M. Effects of stilbene constituents from
rhubarb on nitric oxide production in lipopolysaccharide-activated
macrophages. Bioorg Med Chem Lett, 10:323-327, 2000.
- Matsuda H,
Tomohiro N, Harima K, Harmina S, Ko S, Matsuo K, Yoshikawa M., Kubo M.
Study on anti-Oketsu activity on rhubarb II. Anti-allergic effects of
stilbene components from Rhei undulati Rhizoma (dried rhizome of Rheum
undulatum cultivated in Korea). Biol Pharm
Bull, 24:264-267, 2001.
- Kageura T,
Matsuda H, Morikawa T, Toguchida I, Harima S, Oda M, Yoshikawa M.
Inhibitors from rhubarb on lipopolysaccharide-induced nitric oxide
production in macrophages: structural requirements of stilbenes for the
activity. Bioorg Med Chem, 9:1887-1893, 2001.
- Park
EK, Choo MK, Yoon HK, Kim DH. Antithrombotic and anti-allergic activities
of rhaponticin from Rhei Rhizoma are activated by human intestinal
bacteria. Arch Pharm Res, 25:528-533, 2002.
- Cheong H,
Ryu SY, and Kim KM. Anti-allergic action of resveratrol and related
hydroxystilbenes. Planta Med, 65:266-268, 1999.
- Kim DH,
Park EK, Bae EA, Han MJ. Metabolism of rhaponticin and chrysophanol
8-o-beta-D-glucopyranoside from the rhizome of Rheum undulatum by human
intestinal bacteria and their anti-allergic actions. Biol Pharm Bull, 23:830-833, 2000.
- Aburjai TA.
Anti-platelet stilbenes from the aerial parts of Rheum palaestinum.
Phytochem, 55:407-410, 2000.
- Aggarwal
BB, Bhardwaj A, Aggarwal RS, Seeram NP, Shishodia S, Takada Y. Role of resveratrol in
prevention and therapy of cancer: preclinical and clinical studies. Anti-cancer
Res, 24:2783-2840, 2004.
- Chun
YJ, Ryu SY, Jeong TC, Kim MY. Mechanism-based inhibition of human
Cytochrome P450 1A1 by rhapontigenin. Drug Met Disp, 29:389-393, 2000.
- Guengerich
FP, Chun Y, Kim D, Gilliam EMJ, Shimada T.
Cytochrome P450 1B1: A target for inhibition in anticarcinogenesis
strategies. Mut Res, 182:523-524, 2003.
- Causon R.
Validation of chromatographic methods in biomedical analysis viewpoint and
discussion. J Chrom B, 689:175-180, 1997.
- Teng XW, Cutler DJ, and Davies NM. Kinetics of metabolism and
degradation of mometasone furoate in rat biological fluids and tissues. J
Pharm Pharmacol, 55:617-630, 2003.
- Roupe K,
Teng XW, Fu X, Meadows GG, Davies
NM. Determination of piceatannol in rat serum and liver
microsomes: pharmacokinetics and phase I and II biotransformation. Biomed
Chromatogr, 18:486-491, 2004.
- O’Brien J, Wilson I, Orton T, Pognan F. Investigation of the
Alamar Blue (resazurin) fluorescent dye for the assessment of mammalian
cell cytotoxicity. Eur J Biochem, 267:5421-5426, 2000.
- Roupe K,
Halls S, Davies NM. Determination
and assay validation of pinosylvin in rat serum: application to drug
metabolism and pharmacokinetics. J Pharm Biomed Anal, 38:148-154, 2005.
- Yanez JA,
Teng XW, Roupe KA, Davies NM. Stereospecific high-performance liquid
chromatographic analysis of hesperetin in biological matrices. J Pharm
Biomed Anal, 37:591-595, 2005.
- Skeith KJ, Dasgupta M, Lange R, Jamali F. The influence of renal function on the
pharmacokinetics of unchanged and acyl-glucuroconjugated ketoprofen
enantiomers after 50 and 100 mg racemic ketoprofen.Br J Clin Pharmacol,
42:163-169, 1996.
- Marier JF,
Vachon P, Gritsas A, Zhang J, Moreau JP, Ducharme MP. Metabolism and disposition of
resveratrol in rats: extent of absorption, glucuronidation, and
enterohepatic recirculation evidenced by a linked-rat model. J Pharmacol
Exp Ther, 302:369-373, 2002.
JPPS Contents
Published by the Canadian Society
for Pharmaceutical Sciences.
Copyright © 1998 by the Canadian
Society for Pharmaceutical Sciences.
http://www.cspscanada.org/
CSPS Home |
JPPS Home |
Search |
Subscribe to JPPS