J Pharm Pharmaceut Sci
(www.cspscanada.org) 8(3):593-600, 2005
Efficient size control of amphiphilic
cyclodextrin nanoparticles through a statistical mixture design methodology
Luc Choisnard1,
Annabelle Géze1, Muriel Bigan2, Jean-Luc Putaux3,
Denis Wouessidjewe1
1Université Joseph Fournier – UFR
Pharmacie – DPM UMR 5063 CNRS– Pharmacotechnie, Avenue de Verdun. Meylan cedex
2Université des Sciences et Technologies de
Lille – LCOM - UMR 8009 CNRS - Cité Scientifique Villeneuve d’Ascq cedex
3Centre de Recherche sur les Macromolécules
Végétales - UPR 5301 CNRS Grenoble Cedex
Received June 27, 2005; Revised November 24,
2005, Accepted November 25, 2005, Published December 6, 2005
PDF Version
ABSTRACT Purpose: the aim of
the study was to investigate size control of amphiphilic β-cyclodextrin
nanoparticles obtained by solvent displacement technique. Methods: An experimental design methodology for mixture
design was undertaken using D-optimal approach with the following technique variables:
water fraction X1 (40-70% v/v), acetone fraction
X2 (0-60% v/v) and ethanol fraction X3 (0-60% v/v). Results: The resulting quadratic model obtained after
logarithmic transformation of data and partial least-square regression was statistically validated and experimentally checked. Also,
the morphology of the colloidal nanoparticles from selected experiments was observed
by cryo-transmission
electron microscopy. Conclusions: This experimental
design approach allowed to produce interesting
amphiphilic b-cyclodextrin nanoparticles with a predicted mean
size varying from 60 to 400 nm.
INTRODUCTION
In the pharmaceutical industry, natural
or modified cyclodextrins are interesting excipients to reduce toxicity while
improving stability, solubility and bioavailability of hydrophobic drugs.
Amphiphilic b-cyclodextrins obtained by grafting hexanoic chains
on the secondary hydroxyl groups have the ability to self-organize yielding
stable supramolecular assemblies using the nanoprecipitation technique. These amphiphilic b-cyclodextrin
nanoparticles could be considered as promising carriers for drug molecules (1, 2). In a previous
study, Gèze et al. (3) have
established the correlation between the chemical structure of amphiphilic b-cyclodextrin and their ability to form stable
nanospheres. More recently, the long-term shelf stability of the nanoparticles
was also monitored by photo correlation spectroscopy and cryo-transmission
electron microscopy (4).
The
nanoparticle capacity to associate drug is partially expected to be influenced
by nanoparticle size. This latter parameter could be related to the nature and the
amount of organic solvent involved during nanoparticle manufacturing. The
mechanism of nanoparticle formation is complex and has only been partially understood
(5) although numerous monographs and review articles have been written on the
subject. Then, one
of the major challenges for the design of the colloidal carriers is to define a
solvent or a solvent mixture system suitable to obtain a desired size. However,
one has to keep in mind that, the properties (Mw, polarity,…)
of the drug when associated to amphiphilic b-cyclodextrins carriers,
may also influence the size as well as the bulk structure of the nanoparticles.
The aim of the present work was to set up
experimental procedures allowing the control of nanoparticle size during their
manufacturing. This goal was achieved by using mixture
design methodology in which an empirical correlation was found between the
solvent proportion (water/acetone/ethanol) and the nanoparticle size. In
addition, the morphology and internal structure of the nanoparticles were investigated using cryo-transmission electron
microscopy (cryo-TEM) experiments.
MATERIALS AND METHODS
Natural b-cyclodextrin (b-CD), Kleptose®,
was obtained from Roquette (Lestrem,
France). Anhydrous
pyridine (99%), dichloromethane (99%) and 2, 4-dimethylaminopyridine, hexanoyl
chloride, were purchased from Aldrich. Tetrabutylammoniumfluoride and
tetrahydrofuran were from Avogado and Acros respectively. Ethanol and acetone at
pharmaceutical grade, methanol, cyclohexane and chloroform were purchased from
Sodipro (Grenoble, France). Water was distilled in our
laboratory.
Amphiphilic b-cyclodextrin synthesis
Amphiphilic b-cyclodextrin was prepared with a 3 step procedure from
natural b-cyclodextrin according to a modified procedure described
by Lesieur et al. (6) and Dubes et al. (7): i) protection of primary hydroxyl groups, ii)
acylation of secondary face, iii) deprotection of primary face.
(I) Dried b-cyclodextrin (1g, 1eq.) was mixed
with TBDMSCl (1g, 8eq.) in anhydrous pyridine (40ml) at room temperature under
N2 for 48 hours. The product was precipitated in ice-cooled water,
filtered and washed twice with ice-cooled water. The dried crude product was
then dissolved in a minimum quantity of chloroform and purified by column
chromatography using chloroform/methanol/water (8/1.9/0.1, v/v/v,) as mobile
phase. The pure Heptakis(6-O-tert-butyldimethylsilyl)
cyclomaltoheptaose was obtained with yield of 76%.
(II)
Hexanoyl chloride
(3ml, 42 eq.) was added to a stirred solution of heptakis(6-O-tert-butyldimethylsilyl)
cyclomaltoheptaose (1g, 1 eq.) and 2, 4-dimethylaminopyridine (3g, 49 eq.) in
anhydrous pyridine (40ml). The mixture was heated at 70°C for
48 h, then cooled to room temperature and poured into a large volume of
ice-cooled water. The aqueous phase was removed
by settling and the syrupy residue taken up into dichloromethane. After washing
with dilute sulphuric acid (2%), water and aqueous sodium hydrogen carbonate,
the organic layer was dried (Na2SO4) and concentrated to
a residue which was submitted to flash chromatography using cyclohexane/ethyl
acetate (10/1) as mobile phase.
(III) Tetrabutylammonium fluoride 1M in tetrahydrofuran (3ml, 8 eq.) was added
drop-wise to a stirred anhydrous
tetrahydrofuran (28 ml, eq.) solution of the resulting product (1g, 1 eq.)
obtained from step (II). The mixture was reacted at room temperature under N2
for 44h. The crude
product was then concentrated to dryness and submitted to flash chromatography using ethyl
acetate/cyclohexane/ethanol (8/1.9/0.1, v/v/v,) as mobile phase.
Nanosphere preparation
The nanosphere suspensions were
prepared using
the nanoprecipitation technique firstly developed by LaMer and Dinegar (8) and
applied to amphiphilic cyclodextrin by Skiba et al. (9) 20 mg of b-CDa were
dissolved at 25°C in an organic solvent constituted by acetone or ethanol or in
an acetone/ethanol mixture. The organic solution was poured
slowly through a silicon tube fitted with fine tip into distilled water subjected
to a magnetic stirring. The organic solvents and water volume of each
experiment unit were defined according to an experimental
design worksheet (table 2). The nanospheres were formed
immediately and the colloidal suspension obtained was subjected to evaporation
under reduced pressure to remove organic solvent. The colloidal suspension
obtained was filtered through a 0.8 µm membrane (Millex AA, Millipore, France)
and stored in closed vials at room temperature.
Particle size measurements
The size of the nanospheres was
measured using quasi-elastic light scattering (QELS) with a Zetasiser 3000
instrument (10 mW HeNe laser at 632.8 nm, K7132 correlator, Malvern Instrument,
Malvern, UK). Experimental conditions were the following : temperature 25±0.1°C, reference angle 90°C, viscosity 0,899´10-3 Pa.s, refractive index of the dispersant 1.330. The mean
hydrodynamic diameter of the particles was calculated
using a Contin algorithm with Zetasizer 3000. All the experimental units were analysed in
triplicate.
Transmission electron microscopy
According to the procedure
described elsewhere (10), specimens for cryo-TEM were prepared by
quench-freezing thin liquid films of 0.1% (w/v) amphiphilic b-cyclodextrin nanostructure suspension into liquefied ethane
(-171°C). Once transferred into a Gatan 626 cryoholder, the specimens were
observed at low temperature (-180°C), using a Philips CM200 “Cryo” microscope
operating at 80kV. Micrographs were recorded on Kodak SO163 films.
Experimental design
The influence
of the water/acetone/ethanol mixture on the nanoparticle size was investigated by an experimental design methodology. In
our objectives, the experimental design was chosen to
support a quadratic regression model as adequate to estimate a potentially
complex response function (equation 1).
 (1)
(1)
Where h is the simulation model response, b0 the constant, bi the linear coefficients, bij the interaction coefficients, bii the quadratic coefficients, k the number of
critical variables Xi and e the random error term.
The
solvent fraction levels, which limit the experimental field, were determined
after some preliminary studies. First, due to the high solubility of bCDa in organic solvents, i.e., acetone and ethanol,
nanoprecipitation that occurs via solvent shifting, was not satisfactory when
the amount of water in the medium was under 40%. Secondary, when the amount of
water in the medium was higher than 70%, the low final nanoparticle
concentration in water, following removal of organic solvent, made the
measurement difficult to perform (low limit of scattering intensity). Indeed, nanoparticles
were finally so diluted in aqueous phase that an efficient measure was unfeasible
with the Zetasiser 3000
instrument. No specific
distinctions were postulated between the amount of acetone and ethanol amounts.
The component limits are summarized in
table1.
Standard three-component design
might require too many experiments because all the components
are restricted by upper (X2, X3) or upper and lower (X1)
constraints. Then, mixture solvent formulation was
investigated using a D-optimal design approach (11). D-optimal
design was computed by MODDE v5.0 software (UMETRICS AB, Box 7960, SE-90719
Umeå Sweden)
in twelve experiment units including two central replicates to estimate pure
error. G-efficiency criterion was used to select the
optimal worksheet design set. Finally, run sequence of experimental units was completely randomized to minimize the effect of noise
and then safeguarding the experiment from systematic bias (table 2). All
experiments were performed without replication.
Table 1: Settings levels for each mixture component.
|
labels
|
fraction
|
levels
setting
|
|
low
|
high
|
|
X1
|
U1,
water
|
40% (v/v)
|
70% (v/v)
|
|
X2
|
U2,
acetone
|
0% (v/v)
|
60% (v/v)
|
|
X3
|
U3,
ethanol
|
0% (v/v)
|
60%(v/v)
|
Table 2: Design matrix (G-Efficiency = 69.63), experimental worksheet and
corresponding nanoparticle size response.
|
Experimental
unit
|
Coded
variable
|
Natural
variable
|
Size
±
SD
(nm)
|
IP
|
|
X1
|
X2
|
X3
|
U1
(ml)
|
U2
(ml)
|
U3
(ml)
|
|
1
|
0
|
1
|
0
|
8
|
12
|
0
|
198±12
|
0.06
|
|
2
|
0
|
0
|
1
|
8
|
0
|
12
|
467±4
|
0.57
|
|
3
|
0.5
|
0.5
|
0
|
14
|
6
|
0
|
59±1
|
0.08
|
|
4
|
0.5
|
0
|
0.5
|
14
|
0
|
6
|
67±2
|
0.07
|
|
5
|
0.167
|
0
|
0.833
|
10
|
0
|
10
|
178±11
|
0.18
|
|
6
|
0.333
|
0
|
0.667
|
12
|
0
|
8
|
101±7
|
0.09
|
|
7
|
0.167
|
0.833
|
0
|
10
|
10
|
0
|
108±4
|
0.18
|
|
8
|
0.333
|
0.667
|
0
|
12
|
8
|
0
|
79±3
|
0.07
|
|
9
|
0
|
0.667
|
0.333
|
8
|
8
|
4
|
311±14
|
0.24
|
|
10
|
0
|
0.333
|
0.667
|
8
|
4
|
8
|
387±31
|
0.31
|
|
11
|
0.25
|
0.375
|
0.375
|
11
|
4.5
|
4.5
|
96±3
|
0.06
|
|
12
|
0.25
|
0.375
|
0.375
|
11
|
4.5
|
4.5
|
92±2
|
0.05
|
RESULTS AND DISCUSSIONS
The
objective of the present study was to control the amphiphilic cyclodextrin
self-assembly process to form nanoparticle with the desired size. First,
the amphiphilic cyclodextrins were classically synthesized
in three steps from the natural β-CD as summarized in
figure 1: i) protection of primary hydroxyl groups, ii) acylation of the
secondary face, iii) deprotection of primary face. The
amphiphilic cyclodextrin products obtained was characterized as a statistical
mixture of β-CD variously acylated. The degree of acylation of the secondary alcohol is
theoretically 14 for the b-cyclodextrin. However, it is perfectly known that
in the presence of a large amount of DMAP self-condensation of acyl chains may
occur and hence, leading to the increase of grafted hexanoyl chains on the
β-CD (6, 7, 12). As described in figure 1, this synthesis leads to
a statistical mixture of multisubstituted b-cyclodextrin
containing under and over-acylated b-cyclodextrin
by hexanoyl chains.
Figure 1: Schematic pathway for amphiphilic b-cyclodextrin
synthesis
Then, the electrospray mass
spectrometry characterization clearly demonstrated the presence of a mixture of
numerous derivatives resulting from coupling of 8 to 23 alkanoyl chains (m/z
[M+Na] = 1941.8 to 3412.9).
This
product was used to obtain nanoparticles using nanoprecipitation procedure. The
influence of water/acetone/ethanol mixture ratios involved in the
nanoprecipitation technique on the nanoparticle size response was investigated
by experimental design methodology. Five classical steps were carried out:
choosing adequate model and performing the experimental worksheet as decrypted
in experimental section, fitting the model coefficients, predicting the
response and checking the adequacy of the model (13, 14).
Nanoparticle sizes, standard deviations
(SD) and index of polydispersity (IP) of experimental worksheet are reported in table 2. The SD values are
considered as low for all the experimental units. IP values below 0.25,
generally signed the presence of monodisperse particle suspensions. This is the
case for the nanosuspension of particles with mean size under 300 nm. For the
samples n°2, 9 and 10, IP>0.25 signed polydispersed suspensions.
The
partial least-square process (PLS) which allows fitting the experimental
response with the analytical model and parametric analysis methods, such as
analysis of variance (ANOVA) or t-test, were based on assumptions that the
population characteristics must be drawn from normally distributed populations.
Therefore, the experimental design data distributions were examined for
departures from normality using a Shapiro-Wilk W test extended by Royston (15, 16) that thought to be one of the best tests of
normality for small data samples. The p-value=0.0120 obtained with this W test was less
than 0.05 criterion, then the hypothesis that the data
were normally distributed was rejected. The non-normal distributions of data may
be “fixed” using appropriate transformation of the size response. Box-Cox
transformation procedure (17) was
investigated to find the best transformation that will approximately normalize
the data. The best transformation indicated by the Cox-box procedure which
minimize the residual sum of squares was obtained with a Log10
transformation of the nanoparticle size (Lambda max=0, 103942).
The unknown coefficients b of the equation were
estimated with PLS, which allows fitting the transformed size response
with the analytical model. Corresponding coefficients were
replaced in the following general equation 1:
h=2,09988 - 0.133451X1 + 0.256992X2 +
0.355274X3 + 0.013582X12 + 0.0479853X23 + 0.089019X13
- 0.05337X12 - 0.0712576X22 +
0.148889X32 (2)
The correlation coefficients R2 and
R2Adjusted describe respectively the fraction of
variation of the response explained by the model and the fraction of variation
of the response explained by the model adjusted for degrees of freedom. The
coefficient of prediction Q2 describes the fraction of variation of
the response that can be predicted by the model.
Here, the
coefficient of correlation R2=0.986 and determination R2Adjusted=0.975
showed that quadratic model is well fitted by PLS. Besides, nanoparticle sizes
are well predicted as indicated by the coefficient of prediction Q2=0.879.
The summary of the analysis of variance (ANOVA) procedure based on F-test is shown in
table 3.
Table 3: Regression analysis for the nanoparticle size with quadratic response
surface model fitting. hi is the predicted response of ith
experiment, yi is the measured response of ith
experiment,  is the mean value of measured response, yi0
is the measured response of ith experiment in central positions.
is the mean value of measured response, yi0
is the measured response of ith experiment in central positions.  is the mean value of
response in central position. Variance column was the ratio of sum of squares
by the corresponding degree of freedom.
is the mean value of
response in central position. Variance column was the ratio of sum of squares
by the corresponding degree of freedom.
|
Source
|
Degree of freedom
|
Sum
of squares
|
Mean
square (variance)
|
F value
|
Probability p
|
|
Regression
|
5
|
å(hi- )2
= 1.01586 )2
= 1.01586
|
0.203172
|
87.0796*
|
0.000
|
|
Residual
|
6
|
å(yi-hi)2 = 0.013999
|
0.00233317
|
|
|
|
|
|
|
|
|
|
|
Lack
of Fit
|
5
|
å(yi-hi)2-å(yi0- )2
= 0.0138282 )2
= 0.0138282
|
0.00276564
|
16.1906**
|
0.186
|
|
Pure Error
|
1
|
å(yi0-)2
= 0.000170818
|
0.00017082
|
|
|
* Significant at the level
95%; F0.05 (5, 6) = 4.39
** Significant at the level
95%; F0.05 (5, 1) =230.16
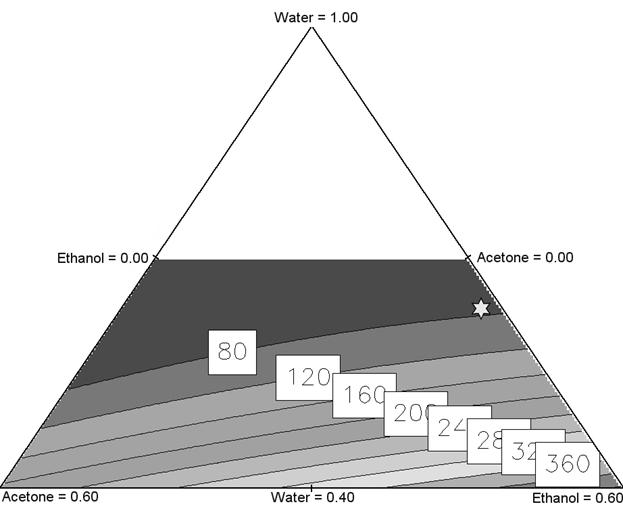
Figure 2: Ternary diagram for nanoparticle size. White star corresponding to the mixture
water/acetone/ethanol=0.64/0.01/0.34 for a size of 82 nm.
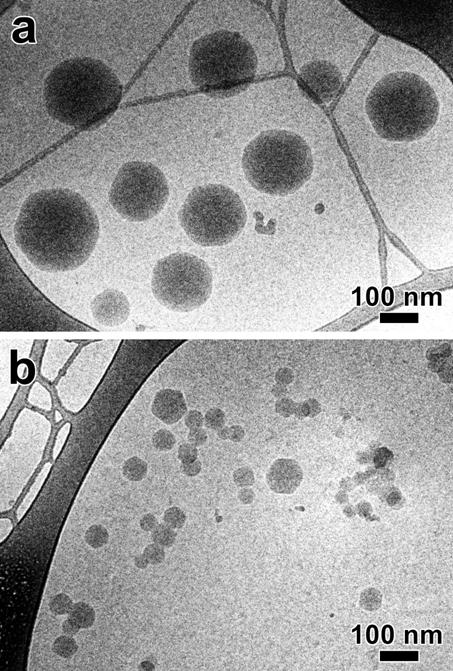
Figure 3: Cryo-TEM images of β-cyclodextrin nanoparticles
in suspensions corresponding to experiment units 9 (a) and 12 (b),
respectively.
The
probability for the model regression is significant at 95% (P-value=0.000<0.05)
and the probability for lack of fit is not significant at 95% (P-value=0.186>0.05).
Hence, the quadratic model is statistically good and has no lack of fit within
the range of variables used.
All the nanoparticles size and the
corresponding solvent mixture were plotted in a ternary diagram (figure 2)
using the equation 2. The solvent proportions were explained in percentage unit
scaled from 0 to 1 in accordance with the limits
defined in table 1. Each point of the diagram corresponds to defined
proportions of acetone, ethanol and water used in the experiment. The white
area depicted on the ternary diagram is an experimentally unexplored zone of
mixture. Each line plotting inside the diagram defines a specific size value
(nm) labelled in the white square.
In order to decrease the nanosphere size,
the nanoprecipitation should be investigated with high
amount of water and low amount of organic solvent. This plot also indicates
that the use of acetone as organic fraction is more efficient than ethanol to
obtain small nanospheres.
An experimental test point focused on interesting
mean size of 82 nm was carried out to confirm the model
validation. The procedure used to predict the corresponding experimental
conditions was the Nelder-Mead simplex method (18). The computation leads to
the optimal following mixture water/acetone/ethanol=0.6428/0.01270/0.3445
(v/v/v). The mean size of nanoparticles obtained when applying these conditions
was measured at 86 nm. This result was in accordance with
the predicted value of 82 nm in 95% confidence interval. Consequently, the
quadratic model was experimentally checked as good.
The
morphology of the colloidal nanoparticles from selected experiments was studied
by cryo-TEM.
Images
of suspensions from experimental units 9 and 12 are shown in
Figures 3a and 3b,
respectively. In both cases, the particles are uniformly dense and spheroidal,
although several of them exhibit a clear faceting. Such a faceting has already
been reported by Gèze et al. (3) for bCDa particles. Those corresponding to experimental unit 9 are
individual while some aggregation is observed in the suspension from
experimental unit 12. The diameter measured from the cryo-TEM images ranges
from 100 to 250 nm and 40 to 100 nm for particles from experimental
units 9 and 12, respectively. The cryo-TEM images leads to a diameter slightly
lower than that measured by QELS (table 2). This observation was because the
values were obtained using different calculation procedures (intensity diameter
for QELS and weight diameter for TEM); it is worth reminding that the QELS
measurement integrates the ionic environment surrounding the particle surface.
As this environment is not substantially denser than the embedding vitreous
ice, it will not be detected in cryo-TEM images.
(3)
CONCLUSION
In
conclusion, this mixture design methodology led to a significant empirical
correlation between the solvent proportion involved in amphiphilic cyclodextrin
self assembling procedure and the corresponding nanoparticle size. With the
output of this study, we are able to prepare nanoparticles with predicted mean
size varying from 60 to 400 nm. In the future, further studies will be carried out to establish the influence of the size
of nanoparticles on their drug loading capacity and to check the long-term
stability of these loaded nanoparticles.
REFERENCES
[1]
Duchêne, D.; Ponchel,
G.; Wouessidjewe, D. Cyclodextrins in targeting application to nanoparticles.
Adv Drug Deliv Rev, 36:29-40, 1999.
[2] Duchêne,
D.; Wouessidjewe, D.; Ponchel, G. Cyclodextrins and carrier systems. J Control
Release, 62:263-268, 1999.
[3] Gèze, A.;
Putaux, J. L.; Choisnard, L.; Jéhan, P.; Wouessidjewe, D. Long-term shelf
stability of amphiphilic b-cyclodextrin
nanosphere suspensions monitored by dynamic light scattering and
cryo-transmission electron microscopy. J Microencapsul, 21(6):607-613, 2004.
[4] Gèze,
A.; Aous, S.; Baussanne, I.; Putaux, J. L.; Defaye, J.; Wouessidjewe, D.
Influence of chemical structure of amphiphilic b-cyclodextrins on their ability to form stable
nanoparticles. Int J Pharm, 242:301-305, 2002.
[5] Horn,
D.; Rieger, J. Organic nanoparticles in the aqueous phase-theory, experiment,
and use. Angew Chemie Int, 40: 4330-4361, 2001.
[6] Lesieur,
S.; Charon, D.; Lesieur, P.; Ringard-Lefebvre, C.; Muguet, V.; Duchêne, D.;
Wouessidjewe, D. Phase behavior of fully hydrated DMPC-amphiphilic cyclodextrin
systems. Chem Phys Lip, 106:127-144, 2000.
[7] Dubes,
A.; Bouchu, D.; Lamartine, R.; Parrot-Lopez, H. An efficient
regio-specific synthetic route to multiply substituted acyl-sulphated b-cyclodextrins. Tetrahedron Lett,
42:9147-9151, 2001.
[8] Lamer,
V. K.; Dinegar, R. H. Theory, production and mechanism of formation of
monodispersed hydrosols. J Am Chem Soc, 72:4847-4854, 1950.
[9] Skiba,
M.; Wouessidjewe, D.; Puisieux, F.; Duchêne, D.; Gulik, A. Characterization of
amphiphilic b-cyclodextrin nanospheres. Int J Pharm,
142:121-124, 1996.
[10] Durrieu,
V.; Gandini, A.; Belcacem, M. N.; Blayo, A.; Eiselé, G.; Putaux, J. L.
Preparation of aqueous anionic poly-(urethane-urea) dispersions: influence of
the nature and proportion of the urethane groups on the dispersion and polymer
properties. J Appl Polym Sci, 94(2):700-710, 2004.
[11] DuMouchel,
W.; Bradeley, J. A simple Bayesian modification of D-optimal designs to reduce
dependence on an assumed model. Technometrics, 36:37-47, 1994.
[12] Höfle,
G.; Steglich, W.; Vorbrüggen, H. 4-dialkylaminopyridines as highly active
acylation catalysts. Angew Chem Int Ed Engl, 17:569-583, 1978.
[13] Annadurai,
G.; Sheeja, R. Y. Use of Box-Behnken design of experiments for the adsorption
of verofix red using biopolymer. Bioprocess and Biosystems Engineering,
18(6):463-466, 1998.
[14] Goupy,
J., Plans d'expériences : les mélanges. DUNOD ed., 2000.
[15] Shapiro,
S. S.; Wilk, M. B. An analysis of variance test for normality
(complete samples). Biometrika, 52:591-611, 1965.
[16] Royston,
P. An Extension of Shapiro and Wilk's W Test for Normality to
Large Samples. Applied Statistics, 31:115-124, 1982.
[17] Box, G.
E. P.; Cox, D. R. An analysis of transformations. J.
Royal Stat. Soc., 26:211-243, 1964.
[18] Nelder,
J. A.; Mear, R. A simplex method for function minimization.
Comput J, 7:308-315, 1965.
JPPS Contents
Published by the Canadian Society for
Pharmaceutical Sciences.
Copyright © 1998 by the Canadian
Society for Pharmaceutical Sciences.
http://www.cspscanada.org/
CSPS Home |
JPPS Home |
Search |
Subscribe to JPPS