J Pharm Pharmaceut Sci
(www.cspscanada.org) 8(3):400-408, 2005
Disodium Ascorbyl Phytostanyl Phosphates (FM-VP4) reduces plasma
cholesterol concentration, body weight and abdominal fat gain within a
dietary-induced obese mouse model
Norbert
A. Looije1, Verica Risovic1, David J. Stewart2,
Daniel Debeyer2, James Kutney2 and Kishor M. Wasan1*
1Division of Pharmaceutics and Biopharmaceutics,
Faculty of
Pharmaceutical Sciences, University of British Columbia, Vancouver BC, Canada
&
2Forbes Medi-Tech Inc, Vancouver B.C., Canada
Received March 19,
2005,Revised June 15, 2005, Accepted August 15, 2005, Published August 24,
2005
PDF
Version
Corresponding Author:
Kishor M. Wasan, Faculty of Pharmaceutical Sciences, University
of British Columbia, 2146
East Mall Avenue, Vancouver, BC,
Canada, V6T 1Z3
kwasan@interchange.ubc.ca
Purpose:
The purpose of this study was to
determine if Disodium Ascorbyl Phytostanol Phosphates (FM-VP4) alters animal body
weight and plasma lipid levels in a dietary-induced obese mouse model. Methods: Twenty-four C57BL6 mice (28
days old) were housed individually and fed a standard mouse diet for 2 weeks
upon arrival. After 2 weeks the animals were weighed and divided in 4 groups of
similar average weight, and the groups received a low fat (10% kcal from fat)
and high fat (45% kcal from fat) diet with or without FM-VP4 (2% w/w) for 12
continuous weeks. Food, water and caloric intake and body weight were recorded
on a daily basis throughout the duration of the study. Following the 12th week of the
study all animals were humanely sacrificed and blood and abdominal fat pads were
harvested for further analysis. Plasma cholesterol, triglyceride, AST/ALT and
creatinine levels were measured using enzymatic
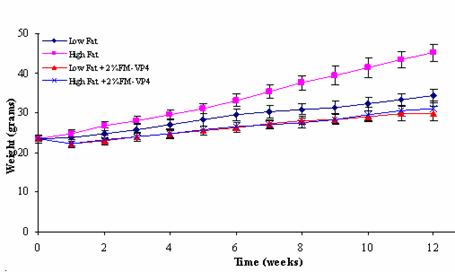
kits. Results: There is a
significant difference in weight gain between the low-fat diet and the low-fat diet
+ 2% w/w FM-VP4 treatment groups (P<0.05), as well as between the high-fat
diet and the high-fat diet + 2% w/w FM-VP4 treatment groups (P<0.05).
However, the reduction of weight gain of the high-fat diet + 2% FM-VP4 treatment
group compared to the high-fat group was 51%, while the reduction in weight
gain between the low-fat diet + 2% w/w FM-VP4 treatment group and the low-fat
diet group was 17% over the duration of the study. No significant differences
in food and water intakes, serum creatinine and AST/ALT levels were observed
between the four groups. No significant differences in caloric intake between
the low-fat diet and the low-fat diet + 2% w/w FM-VP4. However, a significant
difference in caloric intake between high-fat diet and the high-fat diet + 2%
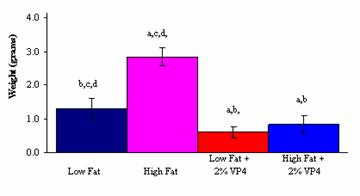
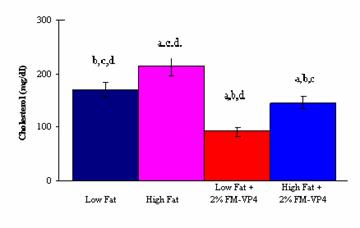
w/w FM-VP4 treatment groups was observed. In addition, significant reductions
in plasma cholesterol levels and abdominal fat pad weight between diet alone and
diet + FM-VP4 treatment groups were observed. Conclusions:
These findings suggest that FM-VP4 may have potential weight-loss and cholesterol
lowering activity in both High Fat and Low Fat Diets treated groups.
INTRODUCTION
The
obesity epidemic has been recognized by the World Health Organization as one of
the top 10 global health problems (1). Worldwide, more than one billion adults
are overweight and over 300 million are obese (1). Most countries are experiencing dramatic
increases in obesity.
Obesity
is a condition associated with the accumulation of excessive body fat resulting
from chronic imbalance of energy whereby the intake of energy exceeds
expenditure. The excess body fat predisposes an obese individual to chronic
diseases, such as coronary heart disease, type 2 diabetes, diseases of the gall
bladder and cancer (2, 3). The high incidence of obesity, its multifactorial
nature and the scarcity of adequate therapeutics have fuelled an increase in
anti-obesity drug-related research. Although a number of pharmacological approaches
have been investigated in recent years, few therapeutically effective products
have been developed (2).
Our laboratory has been investigating the
lipid lowering and anti-atherosclerotic effects of a novel cholesterol
absorption inhibitor, FM-VP4 (disodium ascorbyl phytostanyl phosphates, FM-VP4, Figure 1), in several animal models (4-9).
In several of these studies, we noted that FM-VP4 administration caused a
decrease in body weight without any observable liver or
kidney toxicity or changes
in food
or water intake (7, 8). Although several studies have described the effects of
plant sterols/stanols on significantly decreasing total plasma and lipoprotein
cholesterol levels between 10-20% at doses between 1-5 g/day (10-24), there is
no evidence for any weight loss properties. Therefore, our observation of
non-toxic weight loss appears to be specific for FM-VP4. However, to date,
weight loss studies with FM-VP4 have not been conducted in a dietary-induced
obese animal model. Therefore, the purpose of this study was to determine if
disodium ascorbyl phytostanol phosphates (FM-VP4) alters animal body weight and
plasma lipid levels in a dietary-induced obese mouse model receiving a low-(10% kcal from fat) and high-fat diet
(45% kcal from fat).
MATERIALS
AND METHODS
Chemicals
Disodium
ascorbyl phytostanyl phosphates (FM-VP4; Lot
number: 81699 BRI FM-VP4-06;
Figure 1) was prepared by the chemistry group of
Forbes Medi-Tech Inc. Research Laboratories. FM-VP4 is a semi-synthetic
esterified phytostanol derivative, produced as the disodium salt. The two major
components of FM-VP4 are disodium ascorbyl campestanyl phosphate and disodium
ascorbyl sitostanyl phosphate. The powdered active ingredient was stored at 4oC
and to date has been demonstrated to be stable for up to 12 months under these
conditions. The low and high fat diets were purchased from Research Diets Inc. (New Jersey, USA; See Table 1 for the complete
composition of each diet) (25).
Dietary-Induced Obese Mouse
Model
Four-week-old male C57BL6 mice were
purchased from Charles River Laboratories, Quebec, Canada.
These animals normally exhibit significant weight gain following the
consumption of a high fat-diet (45% kcal from fat) over a 12-week period (25).
Experimental design
Twenty-four C57BL6 mice (4 weeks old) were obtained from Charles River
Laboratories (Montreal, Quebec, Canada).
Upon arrival the animals were acclimatized by being housed individually and fed
a standard mouse diet for 2 weeks. Housing consisted of a 12 h light/dark cycle
at a constant temperature (210C ± 2) and humidity. After 2 weeks the
animals were weighed and divided in 4 groups (n=6 for first 9 weeks, n=5 for
weeks 9-12; one mouse was randomly sacrificed at week 9 for genotyping) of
similar average weight, and the groups received a low fat-diet (10 % kcal from
fat); high fat-diet (45% kcal from fat); low fat-diet + 2% (w/w) FM-VP4 or a
high fat-diet + 2% (w/w) FM- VF4 respectively for 12 consecutive weeks (Table
1). Allocation of treatment to each group
was randomly determined before the start of the study. Homogeneity of groups
was validated on the criteria of body weight, plasma cholesterol and plasma
triglyceride on the day of randomization.
Food, water and caloric intakes (calculated based on the amount of food
consumed daily and the nutritional information provided in table 1) intakes and
body weight were recorded for all animals on a daily basis. Following the 12th
week of the study animals were humanely sacrificed using a CO2
chamber and blood and abdominal fat pads were harvested for further analysis.
Plasma cholesterol, triglyceride, serum creatinine and AST/ALT levels were
determined using enzymatic kits
(Boehringer Mannheim, Germany) as previously described (7,8)
Diet Preparation and Animal Care
Diet preparation was carried
out at Research Diets (Table 1) and FM-VP4 was incorporated into the diet as
previously published (5,7,8). The Animal
Care Committee of the University
of British Columbia
approved the study. The concentration of FM-VP4 in food was confirmed at the
beginning of study. 15-20 grams of the control food was collected in glass
containers, labelled accordingly and stored at 40C. Considering that
the average daily food intake was estimated to be 3 g, mice were administered
about 60 mg FM-VP4 each day, equivalent to 2% (w/w) of the diet.
Collection of blood and harvesting of abdominal fat
pads
At
the end of the study mice were sacrificed using CO2 gas and blood
was taken from the right ventricle.
Blood cells were pelleted by centrifugation and plasma was
harvested. Abdominal fat pads were
removed from the abdomen of each mouse and weighed. The abdominal fat pads (this is the fat from
the dorsal abdomen region of the mouse) were removed by a member of the animal care unit at UBC who was
blinded to the dose group of each individual mouse and used the dissection
technique from the work of Henry et al.
(26).
Statistical Analysis
Results were expressed as mean ± SD (standard
deviation). Statistical analysis were conducted using an analysis of variance
(PCANOVA; Human Dynamic Systems) and assuming unequal variance (Newman Keuls
post-hoc test) was used to assess the differences between the FM-VP4 treatment
groups and the untreated control group for body weight, abdominal fat
weight, plasma lipids, food, water and caloric
intake, AST/ALT and serum creatinine levels. A p-value of less than 0.05 indicated a significant difference between
treated and untreated groups.
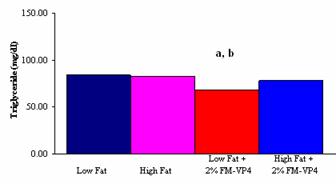
Figure
5: Total plasma triglyceride levels in mg/dl of male C57Bl6 mice on either
Low Fat; High Fat; Low Fat + 2% (w/w) FM-VP4 or High Fat + 2% (w/w) FM-VP4
diet. a. P<0.05 vs. Low Fat; b. P<0.05 vs. High Fat.
Plasma creatinine and AST/ALT levels
No
significant differences in plasma creatinine, AST and ALT levels were observed
for all four groups in this study (data not shown).
DISCUSSION
The purpose of this experiment
was to elucidate if FM-VP4 reduced body weight gain in a dietary-induce obese
animal model. The 2% (w/w) FM-VP4 dose
chosen in this study was based on our previous findings reported in gerbils
(7,8) and ApoE deficient mice (5). In those studies we have reported that
FM-VP4 at 2% (w/w) significantly reduced body weight gain (gerbils only) (8)
and plasma lipid levels (gerbils and mice) (5,8) without any side effects. In
addition, FM-VP4 is well tolerated even at a high daily dose (100 mg/day)
without producing diarrhoea or other gastrointestinal intolerance signs (8).
Furthermore, since FM-VP4 comprises vitamin C (ascorbic acid) and phytostanyl
moieties, covalently linked by a phosphodiester bridge, it is possible that the
effects reported in these studies might be due to the ability of unesterified
stanols to inhibit cholesterol absorption, or the combined effect of free
ascorbate and unesterified stanols following cleavage of FM-VP4 into its
component parts by digestive lipases. Thus, we have compared the effects of
FM-VP4 with equivalent amounts of ascorbic acid or phytostanols given
individually or together in the diet in the ApoE deficient mouse study and
found minimal effects of these components of FM-VP4 (5). Therefore, only FM-VP4
was used in this study.
We observed that the largest effect could be seen between animals
of the High Fat group compared with animals of the High Fat + 2% (w/w) FM-VP4
group, which suggests that FM-VP4 indeed has a weight gain reducing effect when
it is administered to animals that have a high percentage of fat in their diet.
In the 12 weeks this experiment lasted there is a reduction of weight gain of 51%
between the High Fat and the High Fat + 2% (w/w) FM-VP4 groups, while the
weight gain between the Low Fat and the Low Fat + 2% (w/w) FM-VP4 group was reduced
by 17%. Interestingly the food and caloric intake of the animals in the High
Fat group were slightly higher than the animals of all other groups including
the High Fat + 2% (w/w) FM-VP4 group, suggesting that FM-VP4 might have an
appetite suppressing effect since the caloric content of the two High Fat diets
are comparable (Table 1). This is
further supported by the observation that in all of the comparisons beyond week
five of the study there were reductions in food intake in the High Fat + 2%
(w/w) FM-VP4 group compared to the High Fat group. However, this finding was
not observed in the Low Fat control and FM-VP4 treatment groups suggesting that
FM-VP4 may only inhibit the gastrointestinal absorption of excessive fat.
Further studies to explain these findings are required.
There was also a significant decrease in total plasma
cholesterol levels and the weight of abdominal fat pads between the High Fat
and High Fat + 2% (w/w) FM-VP4 groups (Figures 2 and 3). The observation that
the caloric intake was lower in the High Fat + 2% (w/w) FM-VP4 group compared
to the High Fat group could have impacted the difference in body weight gain
(Figure 2), weight of the abdominal fat pads (Figure 3) and plasma cholesterol
levels (Figure 4) in these animals. However, the finding that the High Fat + 2%
(w/w) FM-VP4 group also showed a significant decrease in the values of the
obesity parameters compared to the Low Fat group with an observed lower caloric
intake, shows that the difference in weight gain can be attributed to the
effect of FM-VP4.
The reduced weight gain in the FM-VP4 treatment groups did not
seem detrimental to the animals. All the animals were healthy and active and
showed no signs of any discomfort due to the treatment. The only group that
showed signs of less activity throughout the last 3 weeks of the experiment was
the High Fat group, possibly due to their high body weight. Interestingly the
animals of the Low Fat + 2% (w/w) FM-VP4 and the High Fat + 2% (w/w) FM-VP4
groups had similar characteristics concerning weight gain, plasma cholesterol
and weight of the abdominal fat pads. This observation suggests that FM-VP4 may
inhibit the uptake of excessive amounts of cholesterol, but it does not hinder
the uptake of essential amounts of cholesterol needed by the body to function
properly. Future studies to investigate
this are warranted.
In conclusion, FM-VP4 displayed potential weight-loss and
cholesterol lowering properties in both High Fat and Low Fat Diets treated
groups. These results warrant further investigation in a dose response study to
see if FM-VP4 will show as potent anti-obesity effects in more clinically
relevant doses.
ACKNOWLEDGEMENTS
Funding for this project was
provided by a Collaborative Research Development Grant from the National
Sciences and Engineering Research Council of Canada and Forbes Medi-Tech Inc.
(#CRDPJ 305231-03 to KMW).
REFERENCES
1. Marx J. Cellular warriors at the battle of
the bulge. Science 299:846-849 (2003).
2. Fernandez-Lopez JA, Remesar X, Foz M, Alemany M. Pharmacological
approaches for the treatment of obesity. Drugs 62(6):915-944, (2002).
3. Katzmarzyk PT. The Canadian obesity epidemic, 1985-1998. CMAJ,
166(8);1039-1040 (2002)
4. Ng AW, Lukic T, Pritchard PH, Wasan KM. Development of novel
water-soluble phytostanol analogs:
disodium ascorbyl phytostanyl phosphates (FM-VP4): preclinical pharmacology,
pharmacokinetics and toxicology. Cardiovasc Drug Rev. 21: 151-168 (2003).
5. Lukic T, Wasan KM, Zamfir D, Moghadasian MH, Pritchard PH.
Disodium ascorbyl phytostanyl phosphate
reduces plasma cholesterol concentrations and atherosclerotic lesion formation
in apolipoprotein E-deficient mice. Metabolism 52: 425-431 (2003).
6. Wasan KM, Zamfir C, Pritchard PH, Pederson RA. Influence of
phytostanol phosphoryl ascorbate
(FM-VP4) on insulin resistance, hyperglycemia, plasma lipid levels and gastrointestinal absorption of exogenous
cholesterol in Zucker (fa/fa) fatty and lean rats. J Pharm Sci 92: 281-288
(2003).
7. Wasan KM, Najafi S, Peteherych KD, Pritchard PH: Effects of a
novel hydrophilic phytostanol analog on plasma lipid concentrations in gerbils.
J Pharm Sci 90:1795-1799, (2001).
8. Wasan KM, Najafi S, Wong J, Kwong M, Pritchard PH: Assessing
plasma lipid levels, body weight and hepatic and renal toxicity following
chronic oral administration of a water soluble phytostanol compound, FM-VP4, to
gerbils. J Pharm Pharmaceut Sci
4:228-234, (2001).
9. Wasan KM, Peteherych KD, Najafi S, Zamfir C, Pritchard PH:
Assessing the plasma pharmacokinetics, tissue distribution, excretion and effects
on cholesterol pharmacokinetics of a
novel hydrophilic compound, FM-VP4, following administration to rats. J Pharm Pharmaceut
Sci 4:207-216, (2001).
10. Cullen P, G. Assmann. High-risk strategies for atherosclerosis.
Clin. Chim. Acta. 286(1-2):31-45 (1999).
11. Hendriks HFJ, J.A. Weststrate, T. van Vliet, G.W. Meijer. Spreads
enriched with three different levels
of vegetable oil sterols and the degree of cholesterol lowering in
normocholesterolemic and mildly hypercholesterolemic subjects. Eur. J. Clin.
Nutr. 53:319-327 (1999).
12. Hallikainsen MA, M.I. Uusitupa. Effects of 2 low-fat stanol
ester-containing margarines on serum
choles-terol concentrations as part of a low-fat diet in
hyper-cholesterolemic subjects.
Am. J. Clin. Nutr. 69:403-410 (1999).
13. Gylling, H, T.A. Miettinen. Cholesterol reduction by different
plant stanol mixtures and with
variable fat intake. Metabolism 48:575-580 (1999).
14. Jones PJH, F.Y. Ntanios, M. Raeini-Sarjaz, C.A. Vanstone. Cholesterol-lowering
efficacy of a sitostanol-containing
phytosterol mixture with a prudent diet in hyperlipidemic man. Am. J. Clin.
Nutr. 69:1144-1150 (1999).
15. Weststrate JA, G. W. Meijer. Plant sterol-enriched margarines and
reduction of plasma total- and LDL-cholesterol concentrations in
normocholesterolemic and mildly hypercholesterolemic subjects. Eur. J. Clin.
Nutr. 52:334-343 (1998).
16. Jones PJ, T. Howell, D.E. MacDougall, et al. Short-term
administration of tall oil phytosterols improves plasma lipid profiles in
subjects with different cholesterol levels. Metabolism 47:751-756 (1998).
17. Gylling H, R. Radhakrishnan, T.A. Miettinen. Reduction of serum
choleserol in postmenopausal women with previous myocardial infarction and
cholesterol malabsorption induced by dietary sitostanol ester margarine: women
and dietary sitostanol. Circulation 96:4266-4231 (1997).
18. Gylling H, T.A. Miettinen. Effects of inhibiting cholesterol
absorption and synthesis on cholesterol and lipoprotein metabolism in
hypercholesterollemic non-insulin dependent diabetic men. J. Lipid Res.
37:1776-1785 (1996).
19. Miettinen TA, P. Puska, H. Gylling, et al. Reduction of serum
cholesterol with sitostanol-ester margarine is a mildly hypercholesterolemic
population. New England J. Med.333:1308-1312
(1995).
21.
Gylling H, M.A. Siimes, T.A. Miettinen.
Sitostanol ester margarine in dietary treatment of children with familial
hypercholesterolemia. J. Lipid Res. 36:1807-1812 (1995).
22.
Vanhanen HT, J. Kajander, H. Lehtovirta, T.A.
Miettinen. Serum levels, absorption efficacy, fecal elimination and synthesis
of cholesterol during increasing dosing of dietary sitostanol esters in hypercholesterolemic subjects. Clin. Sci.
87:61-67 (1994).
23.
Gylling H, T.A. Miettinen. Serum cholesterol
and cholesterol and lipoprotein metabolism in hypercholesterolemic NIDDM
patients before and during sitostanol ester-margarine treatment. Diabetologia. 37:773-780 (1994).
24. Becker M, D. Staab, K. Von Bergmann. Treatment of severe familial
hypercholesterolemia in childhood with sitosterol and sitostanol. J. Pediatr.
122:292-296 (1993).
25. Hildebrandt AL,
Kelly-Sullivan DM, Black SC. Antiobesity effects of chronic cannabinoid CB1
receptor antagonist treatment in diet-induced obese mice. European Journal of
Pharmacology 462: 125-132 (2003).
26. Henry M,
Ghibaudi L,
Gao J,
Hwa JJ.Energy metabolic profile of mice after
chronic activation of central NPY Y1, Y2, or Y5 receptors. Obes Res.
2005 Jan;13(1):36-47.
JPPS Contents
Published by the Canadian Society
for Pharmaceutical Sciences.
Copyright © 1998 by the Canadian
Society for Pharmaceutical Sciences.
http://www.cspscanada.org/
CSPS Home |
JPPS Home |
Search |
Subscribe to JPPS