J Pharm Pharmaceut Sci (www.cspscanada.org) 8(2):272-288, 2005
Rapid quantitative analysis of magnesium stearate in tablets using laser-induced breakdown spectroscopy
Louis St-Onge,a Jean-François Archambault,b Elizabeth Kwong,b Mohamad Sabsabi,a and Elizabeth B. Vadasc
a National Research Council Canada, Industrial Materials Institute, Boucherville, Québec, Canada; b Merck Frosst Canada & Co.,Pointe-Claire–Dorval, Québec, Canada
c InSciTech Inc.
Corresponding Author. Louis St-Onge, IMI-NRC, 75 de Mortagne Blvd., Boucherville, Québec J4B 6Y4, Canada. louis.st-onge@cnrc-nrc.gc.ca
Received April 27, 2005, Revised July 10, 2005, Accepted July 12, 2005, Published August 5, 2005
ABSTRACT. Purpose: Laser-induced breakdown spectroscopy (LIBS) was evaluated for its potential as a process analytical tool for the rapid determination of magnesium stearate (MgSt) distribution within and between tablets as well as between batches in a typical manufacturing run, and for the comparison of direct-compression and roller-compaction processes. Methods: These studies were conducted using a prototype instrument and a commercial PharmaLIBS™ unit, both based on pulsed Nd:YAG laser radiation at 1064 nm. The intensity of a magnesium spectral line either at 517.27 or 518.36 nm was used, depending on the product, to quantitate the MgSt concentration in the tablets. Results: Using internal standardization, it was possible with the prototype instrument to accurately quantitate MgSt at the 0.5% level in two different products. For eight batches of one product, using 10 tablets from each batch, the intra-tablet, intra-batch, and inter-batch MgSt %RSDs were found to be 13.8%, 5.4% and 7.4%, respectively. Further studies were conducted with the commercial LIBS unit, which showed similar performance as the prototype unit. In particular, it was found that different depth-profile distributions of MgSt were associated with roller-compacted tablets and direct-compressed tablets. Conclusion: These findings illustrate the potential of LIBS to be developed as a process analytics tool for the direct and rapid determination of MgSt content and distribution in tablets.
INTRODUCTION
In laser-induced breakdown spectroscopy (LIBS), also known as laser-induced plasma spectroscopy, a pulsed laser beam is focused directly on the sample to be analyzed, thus vaporizing a small portion of the sample and producing a luminous microplasma. The light emission from the atoms and ions of the plasma is analyzed through optical emission spectroscopy in order to infer the elemental composition of the sample. LIBS finds more and more application in process monitoring in a variety of industries due to its rapidity, its non-contact optical nature, and its freedom from a sample preparation step, characteristics which together enable near real-time in-situ measurements in a laboratory or industrial setting. The capabilities of LIBS for quantitative elemental analysis have been demonstrated in metallurgy, mining, environmental analysis and numerous other fields (1-4). In the pharmaceutical sector, the interest in LIBS has appeared only recently, primarily for the quantitation of the active pharmaceutical ingredient (API) in solid dosage forms (5-7). In addition to the API, this measurement principle can be applied to other components of solid dosage forms, including the lubricant (7-10) and the coating (11,12), as well as to liquid formulations (13). Consequently, the importance of the technique is beginning to be recognized in the compendium (14). Many of its characteristics suggest that a LIBS instrument, as a rapid analyzer which may or may not be included in a feedback loop, may fit in the process analytical technology (PAT) initiatives set by the Food & Drug Administration (15).
The objective of this paper is to evaluate the feasibility of using LIBS for the detection and quantitation of the lubricant magnesium stearate (MgSt) in tablets. Magnesium stearate is the most commonly used lubricant in pharmaceutical manufacturing (16). The information on the blend uniformity of the lubricant is important for a formulation scientist in order to optimize the lubricant level and lubrication time since both impact the compaction behaviour, mechanical strength and dissolution characteristics of the dosage form.
To date, very limited options have existed for the simple and direct quantitation of MgSt in tablets. Lubricant content is usually evaluated by indirect means, using mechanical and dissolution tests conducted on the tablets. Otherwise, the pharmacopeial methods for quantitation of MgSt require lengthy titration procedures (17). Elemental magnesium analysis is possible using inductively-coupled plasma (with atomic emission, or mass spectrometry), but this technique requires a time-consuming sample digestion step. Finally, near-infrared reflectance spectroscopy, as LIBS, provides a rapid means for determination of MgSt, but compared to LIBS, its calibration is more specific to the formulation and manufacturing process and therefore requires a larger set of calibration standards (10). The goal of the current work is to demonstrate that LIBS is capable of a direct and rapid determination of lubricant content. The concentration of MgSt is obtained from a simple calibration curve of the intensity of a magnesium spectral line emitted from the laser-produced plasma. This assumes the absence of magnesium in other components of the tablets. The application of LIBS in the determination of MgSt tablet content has been reported previously (7-10), as part of blending optimization studies. In contrast, this paper focuses on achieving accurate MgSt quantitation, which may warrant internal standardization, and on evaluating MgSt distribution in tablets manufactured by two different processes: direct compression and roller compaction. This work also compares findings obtained using a prototype research instrument and a commercially available LIBS unit designed to be used as an at-line analytical tool in research, pilot plant and production environments.
MATERIALS AND METHODS
Instruments and spectroscopic conditions
A LIBS setup is typically composed of three main components: (i) the pulsed laser, which vaporizes the sample, (ii) the spectrograph, which spectrally disperses the light collected from the plasma, and (iii) the detector, activated after the laser pulse only during the period when the plasma is analytically useful.
Prototype LIBS system: For initial feasibility studies aimed at
establishing a procedure for the evaluation of MgSt content variations in
formulations, a prototype LIBS unit was used. Figure 1
shows a schematic drawing of this setup. A pulsed Nd:YAG laser (Surelite I-10,
Continuum,
Commercial system: Formulation experiments were conducted
in the Pharmaceutical Research and Development laboratories at Merck Frosst
Canada & Co. (

Figure 1: Experimental setup for the analysis of tablets by LIBS.
The tablets were held in a custom-made sample holder which could accommodate many tablets of different sizes (from approx. 6 to 12 mm in diameter). The sample holder was itself mounted on a motorized X-Y stage, allowing programmable analysis at several sites on a given tablet, and the displacement from tablet to tablet. All experiments were performed in ambient air at atmospheric pressure.
Materials
Tablets for development of quantitation procedure: For the feasibility study, variation of MgSt content was evaluated within a given batch and between eight different batches of a commercial drug product (with 12.5% w/w drug loading), designated here as Product A. For each batch, 10 tablet samples were analyzed. The 200-mg tablet weight contained MgSt at a nominal concentration of 0.5% w/w. The tablets were round, with a diameter of approximately 6.4 mm. A limited series of measurements was also performed on Product B with a different API and formulation, which contained a nominal MgSt concentration of 0.55% w/w. MgSt levels from both Products A and B were measured using the research prototype unit.
Tablets for comparison of tableting processes: Roller-compacted ribbons and tablets from a development batch of Product X was also used for the quantitation of MgSt using the commercial LIBS system. The MgSt distribution obtained from the direct-compression (DC) and roller-compaction (RC) processes were also compared. In Product X formulation, a 1.0% w/w MgSt content was used. For the DC process the total amount of MgSt was added to the blend prior to tablet compression. However, for the RC process 0.45% of the MgSt nominal concentration was added to the powder blend prior to compaction of the ribbon as intragranular lubricant, and the rest of the MgSt, 0.55%, was added to the granules prior to tablet compression.
Measurement procedure
In Ref. 7, two magnesium lines (appearing at 285.21 and 518.36 nm) were evaluated as possible candidates for the quantitation of MgSt. It was shown that the line at 518.36 nm provided a more linear response to MgSt concentration. This line was used for the feasibility study reported here. Figure 2 shows the relevant portion of spectrum, which also includes lines from atomic hydrogen and carbon, as well as emission from the diatomic fragment C2. The magnesium signal was defined as the net peak height, i.e. the intensity at the centre (maximum) of the Mg(I) 518.36 nm line, minus the background signal. For magnesium analysis in Product-X formulation, the neighbouring Mg(I) 517.27 nm line was used for quantitation because of a spectral interference at 518.88 nm from calcium, which was present in this formulation.
In the feasibility study, the eight batches of Product A (with 10 tablets from each batch) were used to determine the intra-batch and inter-batch uniformity of MgSt content. At a given position on a tablet, the signal from 10 laser shots (after 2 priming shots) was averaged. This constituted one measurement and was repeated at 16 positions spaced by 0.75 mm in a 4 x 4 square array. The depth reached at each position (with 12 laser pulses) was approximately 0.5 mm. The measurement at the first position was discarded (because of a time lag when going from one tablet to the next), and the remaining 15 measurements were averaged, giving a unique value for a tablet. The measurement time for each tablet was 58 seconds. When evaluating intra-tablet uniformity, the measurements at the 15 positions were not averaged, but instead considered separately.
For Product X, the determination of MgSt depth-profile distribution from different tableting processes was performed on three tablets using 12 sites/tablet and 25 shots/site. For the quantitation of MgSt in the RC-ribbon, 13 sections of 1.7 cm2 size were cut from the ribbon, and each section was analyzed on 17 sites with 22 shots/site. To avoid contamination, the first two shots from each site were discarded.
Calibration
For accurate quantitation of MgSt in Products A and B (but not in Product X), the use of internal standardization was required in order to eliminate a matrix effect. In the present case, carbon was a suitable internal standard because its concentration in the sample did not depend significantly on the lubricant concentration. As shown in Figure 2, carbon lines at either 495.72 (which is in fact the 247.86 nm line appearing in the second order of diffraction) or 505.2 nm could be used as internal standard. In this feasibility study, the magnesium-to-carbon line intensity ratio was calculated using the 495.72 nm carbon line. The Mg/C intensity ratio was observed to increase linearly with the lubricant concentration, as had been found previously for the non-normalized Mg 518.36 nm line (7). Calibration standards consisted of tablets of the same formulation as Product A, but without the API. A three-point calibration run, including the origin and points at 0.25% and 0.5% w/w MgSt, was carried out (with one tablet per concentration) before and after analysing the unknowns. The same sampling procedure was used for the calibration tablets as described above for the unknowns. In the case of Product X, the alternative line at 517.27 nm was used for the quantitation, with no standardization. Reproducibility and accuracy was achieved by using standard tablets made from the same formulation and process as that of the samples. Also, because the number of compressions differed between the direct compression (DC) and roller compaction (RC) processes, calibration curves and linearity of MgSt in RC-tablets and DC-tablets were compared. Standard tablets for the direct-compression case were prepared using Product-X formulation and adding the MgSt to the blend before the final compression. The MgSt nominal concentration range for the standards was set between 0.5% and 3.0% w/w with 0.5% increments. For RC tablets, granules ranging from 0.45 to 3% w/w were used. The calibration curves were defined over six concentrations using 3 tablets per concentration. Each standard was analyzed on 12 sites/tablet with 27 shots/site where the first two shots were ignored.
Figure 2: Sample spectrum in the vicinity of the Mg(I) 518.36 nm line (at the far right) showing other atomic and diatomic emissions. The strong carbon line at approximately 496 nm is in fact the C(I) 247.86 nm line appearing in the second order of the spectrograph.
For MgSt quantitation in the RC-ribbon, DC-standards were prepared with nominal concentrations of 0.5% to 1.5% w/w, using three tablets per concentration. Each standard was analyzed on 17 sites/tablets and 22 shots/site. The calibration standards were analyzed before and after the analysis of the unknowns.
Statistics
Data were compared using the single factor analysis of variance (ANOVA) test. The ANOVA test was also used when multiple groups were compared. This statistical function was available in Microsoft® Excel from MS Office 97, and used a 95% confidence interval. For verification of outliers, the modified Thompson Tau technique was used and was based on the following equation:
| dI =½xi – xAVG½ > tN Std (1) |
where xi is the value to be tested, xAVG is the average of all responses, Std is the standard deviation, and tN is a tabulated value for a given sample number N. If the dI was greater than the Tau factor (tN Std), the value was considered to be an outlier.
Calibration curves were fitted using the linear or second-order polynomial equation found in the PharmaLIBS software (version 1.2).
RESULTS AND DISCUSSION
Quantitation of the lubricant
The lubricant concentration in Product A was first estimated using the calibrated Mg intensity. As shown in Table 1, the concentration values were found to lie between 0.66 and 0.89% (0.81% on average), well above the nominal concentration (0.5%). The lubricant content in these batches was also measured by inductively-coupled plasma atomic emission spectroscopy and was found to be close to the nominal value. Consequently, Table 1 indicates that LIBS measurements using the Mg line intensity at 518.36 nm overestimated the lubricant content. This systematic error can be attributed to a matrix effect, possibly as a consequence of carrying out the calibration with placebos instead of tablets containing the API, i.e. with non-matrix-matched calibration tablets. Although the API did not contain magnesium, its presence might have affected the physical laser-matter interaction in a way that indirectly modified the magnesium emission. For instance, such a matrix effect could result from a change in ablated mass, that itself results from a change in absorption of the 1064 nm laser beam. Moreover, the lubricant and the other excipients contained in the calibration tablets and the unknown tablets may not have the same characteristics in terms of granulometry and purity.
Table 1: Average of Mg line intensity for the 10 tablets of each batch of Product A, and tentative magnesium stearate concentration determined from the calibrated Mg signal.
| Batch id. |
Mg signal (counts) |
Mg stearate (wt.%) |
| 1 |
8885 |
0.84 |
| 2 |
7004 |
0.66 |
| 3 |
8539 |
0.81 |
| 4 |
8828 |
0.83 |
| 5 |
9479 |
0.89 |
| 6 |
9050 |
0.85 |
| 7 |
7923 |
0.75 |
| 8 |
8674 |
0.82 |
Table 2: Summary of results on uniformity of magnesium stearate concentration in tablets of Product A
| ANOVA |
||||
| Average %RSD |
%RSD range |
Fcrit |
F |
|
| intra-tablet |
13.8 |
6.9 – 21.9 |
N/A |
N/A |
| intra-batch |
5.4 |
3.5 – 8.5 |
Refer to Table 3 |
|
| inter-batch |
7.4 |
N/A |
Fcrit (7,72) = 2.1 Fcrit (6,63) = 2.2 * |
16.4 7.2 * |
| * ANOVA test excluding the outlier (batch 2) |
||||
Figure 3: (A) Intensity of the Mg(I) 518.36 nm, C(I) 247.86 nm (in the second order), and H(I) 486.13 nm lines from LIBS analysis of tablets containing magnesium stearate. The data point on the left corresponds to the average for the two calibration tablets with 0.5% magnesium stearate. The other points represent averages of ten tablets for each batch of Product A; (B) Mg/C and Mg/H line intensity ratios for the same data as in (A).
In order to minimize this systematic error, internal standardization was carried out. As was shown in Figure 2, emissions from C, C2 and H are found in the vicinity of the 518.36 nm magnesium line. Figure 3A shows the average line intensities for carbon and hydrogen as well as for magnesium, obtained from the eight batches of Product A, as well as the average signal for the two calibration tablets containing the nominal concentration of 0.5% MgSt. The Mg, C and H intensities were all higher for the unknown tablets than for the calibration tablets, confirming the previously observed overestimation. These results implied that the overall plasma luminosity (not just the magnesium signal) varied when different types of tablets were analyzed. In other words, physical characteristics of the tablets, instead of just the chemical content, affected the plasma emission. As a result, a ratio of two lines was used to standardize the results from different tablet types, thus decreasing the variability.
Figure 3B reveals that the Mg/C or Mg/H intensity ratios obtained with the unknowns are very similar to those found with the 0.5% calibration tablets. In other words, using an intensity ratio instead of the magnesium signal alone eliminated the previous systematic error. Figure 4A gives the batch-averaged lubricant content in the eight different batches of Product A, based on the calibrated Mg/C intensity ratio. The lubricant content in Product A appears to be close to the nominal value of 0.5%, with some variation from batch to batch.
The validity of this internal standardization approach was further confirmed by measurements on tablets of Product B. These tablets contained a nominal MgSt concentration of 0.55% instead of 0.5%. Using the calibrated Mg signal alone, the same overestimated concentrations of approximately 1% were also obtained. In contrast, when the Mg/C ratio was used, concentrations ranging between 0.54 and 0.57% were obtained (Figure 4B), which agree closely with the nominal concentration.
Lubricant distribution in Product A
The uniformity of the distribution of lubricant in Product A has been evaluated at different scales, by examining the relative standard deviation (%RSD) of the Mg/C intensity ratio for different sites on a tablet (intra-tablet), and by using the single-factor analysis of variance (ANOVA) test for intra-batch (i.e. inter-tablet of a same batch) and inter-batch variations.
The study of the uniformity of MgSt in Product A is summarized in Table 2. The obtained inter-batch %RSD was 7.4%, which was considered to be reasonably uniform. However, the inter-batch result given by the ANOVA test showed that the different batches were statistically different. This could mean that the lubricant found at the tablet surface was distributed differently between the batches. In Figure 4A, the lubricant content for the different batches was close to the nominal concentration, except for batch 2 which was below 90% of the nominal concentration. The concentration found in batch 2 is reported in Table 3, and was considered to be an outlier. The removal of this outlier improved the ANOVA test for inter-batch analysis, but the MgSt distribution between batches was still statistically different.
In Table 2, the intra-batch analysis showed an average %RSD for all batches of 5.4% with a range from 4% to 9%. The intra-batch ANOVA analysis results given in Table 3 show that for half of the 8 batches tested, the MgSt concentration found within a batch was considered statistically similar. This showed that the MgSt distribution was uniform within each tablet within each batch. Moreover, the correlation of the intra-batch ANOVA result with the %RSD showed that the MgSt distribution was statistically uniform when the %RSD was lower or equal to 5% (Table 3). The significance of these results to the actual manufacturing process and dissolution results will be examined in future work.
Using 80 tablets, the intra-tablet average %RSD for 15 positions/tablet was 13.8%. The %RSD range found in this data set was 7% to 22% (Table 2). Although only approximately 1 mg of material was sampled at each position using 200 mg total tablet weights, the 15 positions per tablet were distributed over an area of 5 mm2 on the tablet surface. The intra-tablet %RSD value therefore gives an indication of uniformity across a significant portion of the tablet surface (of 32 mm2 area). Increased surface coverage could be attained in a true 2D-mapping experiment by using a larger number of analyzed positions or larger distances between analyzed positions. More generally, an improvement in the reproducibility of the LIBS response could be achieved in some cases by increasing the mass of material sampled by the laser. The mass of material analyzed by LIBS can be adjusted simply by changing the number of laser pulses per position, or the number of positions per tablet.
Linearity determination of Mg 517.27 nm spectral line for Product X
Further investigation of this MgSt measurement scheme was pursued using the commercial LIBS system in a laboratory setting. A method was developed to help optimize the formulation and determine the lubricant level of a development batch of Product X during processing. Figure 5 shows the spectral interference from the Ca 518.88 nm line that prevented the use of the Mg line at 518.36 nm. The linearity of the alternative Mg line at 517.27 nm was investigated. As shown in Figure 6, the 517.27 nm line responded linearly when the nominal concentration was within the range of 0.45% to 1.5% w/w. However, at higher concentration a better fit was only achieved using a second-order polynomial function.
Table 3: Average and %RSD of Mg/C line intensity ratio for the 10 tablets of each batch of Product A, and magnesium stearate concentration determined from the calibrated Mg/C ratio
| Batch id. |
Mg/C ratio |
Intra-batch |
Mg stearate |
F |
Fcrit |
| 1 |
1.68 |
8.5 |
0.53 |
4.9* |
Fcrit (9,140) = 1.9 |
| 2 |
1.32 |
4.9 |
0.42 |
2.0☨ |
Fcrit (9,129) = 2.0 |
| 3 |
1.50 |
3.5 |
0.48 |
1.0☨ |
Fcrit (9,136) = 1.9 |
| 4 |
1.52 |
6.5 |
0.48 |
3.3* |
Fcrit (9,140) = 1.9 |
| 5 |
1.60 |
3.7 |
0.51 |
1.0☨ |
Fcrit (9,140) = 1.9 |
| 6 |
1.54 |
6.0 |
0.49 |
2.5* |
Fcrit (9,140) = 1.9 |
| 7 |
1.50 |
5.4 |
0.48 |
2.3* |
Fcrit (9,140) = 1.9 |
| 8 |
1.67 |
5.0 |
0.53 |
1.4☨ |
Fcrit (9,140) = 1.9 |
| * The 10 tablets are considered statistically different ☨The 10 tablets are considered statistically similar |
|||||
Figure 4: Magnesium stearate concentration in different batches of (A) Product A and (B) Product B, based on the calibrated Mg/C line intensity ratio. Horizontal lines indicate the nominal magnesium stearate concentration in each case as well as values at 90% and 110% of nominal.
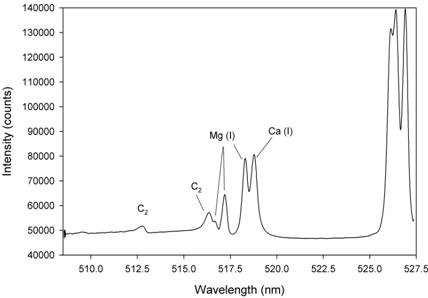
Figure 5: Sample spectrum in the vicinity of the Mg(I) 517.27 nm line obtained using a PharmaLIBS™ 200 system, showing other atomic and diatomic emissions.
Table 4: Magnesium line intensity for RC-tablets of Product-X formulation and comparison of tentative MgSt concentration determined from calibrated Mg signal using DC and RC processes
| Tablet id. |
Mg signal (counts) |
Mg stearate found with DC curve (wt.%) |
Mg signal (counts) |
Mg stearate found with RC curve (wt.%) |
| 1 |
270415 |
1.8 |
237402 |
1.1 |
| 2 |
282231 |
1.9 |
254306 |
1.2 |
| 3 |
259807 |
1.7 |
245963 |
1.1 |
| 4 |
267511 |
1.8 |
265773 |
1.2 |
| 5 |
261132 |
1.7 |
251777 |
1.2 |
| 6 |
265706 |
1.8 |
250595 |
1.1 |
| 7 |
269006 |
1.8 |
258933 |
1.2 |
| Average |
267972 |
1.8 |
252107 |
1.1 |
| %RSD |
2.8 |
3.6 |
3.6 |
4.1 |
Influence of granulation process on MgSt distribution
Figure 6 also shows that the choice of process, direct compression vs roller compaction, influenced the Mg signal. In RC-tablets, half of the MgSt was added as extragranular lubricant after the granules were formed. It is of note that in RC-tablets the lubricant was found to be unevenly distributed between the granules (inter-) and within the granules (intra-). Figure 7 compares the MgSt depth-profile distribution between RC and DC-tablets compressed at 2000 psi (13.8 MPa), which again showed the differences in the distribution of MgSt between the two processes. In DC-tablets, MgSt was evenly distributed at the surface of the tablet. On the other hand, for RC tablets, as shown in Figure 8, the inter-granular MgSt, which is significantly smaller in particle size compared to the granules, segregated toward the lower face of the tablet perhaps due to percolation of smaller particles and toward the upper face due to air entrainment. The degree of segregation affected the amount of MgSt found on each side of the tablets. Therefore, for best representation of the MgSt levels, both sides of a tablet should be taken into account for quantitation. This unequal distribution of the lubricant between different tablet faces can affect the adhesion of film coating and thus it is an important attribute of the tablet core if it is to be made into a film-coated tablet. Different levels of MgSt on the two tablet faces can result in differences in the hydrophobicity of the surfaces and could result in poor adhesion of the film coat on one tablet face compared to the other. Furthermore, unequal distribution of the lubricant would result in different interactions between tablet and the upper and lower punch of the tablet press
Figure 6: Signal and linearity comparison using magnesium at 517.27 nm for different tableting processes.
In Figure 7, an increased Mg signal for RC-tablets when compared to DC-tablets can also be attributed to second compression in the case of RC-tablets. As shown in Figure 9, it is clear that double compressions of DC-tablets increased the Mg signal. All DC-tablets were prepared using the same formulation and blends. Tablets were manually crushed and recompressed at the same compression pressure. This phenomenon could be explained by the fact that during the first compression, MgSt is more evenly distributed through the whole tablet because segregation is not as important due to similarity in particle size between the MgSt and the other excipients. However, after the first compression and crushing, the fines from the extra-granular MgSt migrate to the surface of the tablet due to segregation effects (percolation and air entrainment) while the intra-granular MgSt remains within the tablet. As a result, the amount of MgSt found at the surface of the tablet becomes higher than what is found after a single compression. On the other hand, it is also shown in Figure 9 that with a higher number of compressions, the Mg signal decreased. It is possible that by increasing the number of crushing steps, the amount of extra-granular MgSt decreases since it is forced into the granules. In other words, the MgSt found at the surface of the tablet was now found within the tablet. This uneven distribution also translated into increased variability, as shown in Figure 9.
Lubricant in roller-compacted samples
Quantitation of MgSt in RC-samples was performed using DC and RC calibration curves for comparison. Table 4 shows that the use of the calibration curve from a DC tablet can contribute to an overestimation of the MgSt concentration of about 80%. However, by using the same tableting process, the MgSt estimation improved with respect to the nominal concentration. Similar findings were recently reported for the API (18). However, the estimation of MgSt using the RC curve was still about 10% above the claim, which may be due to the differences in the formulation of the granules. The granules used to prepare the standards contained a 30% drug load while those of the samples had 20%. It is possible that the corresponding change in the concentration of binder/filler used in this formulation, dibasic calcium phosphate, could modify the ionization equilibrium in the plasma because of a different calcium content.
Roller-compacted ribbon was also analyzed for MgSt content. Since the ribbon was an intermediate step in the tableting process and that the sample was only compressed once, the DC calibration curve was used. The RC-ribbon analyzed is illustrated in Figure 10. Each section was analyzed and the MgSt concentration found was given in parenthesis in the figure. In this illustration, the hatched sections represent broken parts or sections that were too small to be analyzed. The average concentration found from section to section was 0.58% w/w, with a RSD of 13%. The 30% overestimation for MgSt could be explained by the different compression method used compared to the standard. For the ribbon, the blend is fed into the roller-compactor through a screw at a set speed, while the standards are prepared and directly compressed similarly to tablets.
Figure 7: Comparison of depth-profile distribution for MgSt between roller-compaction and direct-compression processes.
Figure 8: Effect of segregation on magnesium stearate depth-profile distribution, for roller-compacted tablets.

Figure 9: Effect of the number of compressions on LIBS magnesium signal.
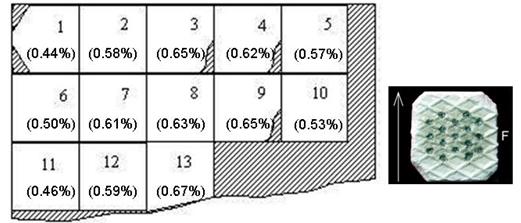
Figure 10: Magnesium stearate distribution on a roller-compacted ribbon. The magnesium stearate quantitation shown in parenthesis was found using an external direct-compressed tablet calibration curve.
CONCLUSIONS
This work has successfully demonstrated the usefulness of LIBS for carrying out studies of MgSt blend uniformity and distribution in tablets. The ability of LIBS to provide a direct and rapid analysis of solid pharmaceutical samples, with no sample preparation comes, however, with the limitation that the analytical signal generally depends on the nature of the solid matrix where the analyte is found. In particular, the degree of absorption of the laser beam and the extent of vaporization and atomization of the material will depend on the material’s composition and physical properties. Recent work aims at shedding light on such matrix effects (19). Nevertheless, it was shown in the present work that the magnesium/carbon line intensity ratio can provide a robust quantitative analysis of MgSt. A matrix effect observed when using the magnesium signal alone was eliminated when using such internal standardization.
Using the Mg/C line intensity ratio, it was possible using a prototype unit to assess the intra-tablet, intra-batch (i.e. inter-tablet), and inter-batch variability for tablets containing a nominal MgSt concentration of 0.5%. The corresponding %RSDs were 13.8%, 5.4% and 7.4%, respectively. Useful information about blend uniformity at different mass scales was thus obtained in only a few hours, 80 tablets being analyzed at a rate of approximately one tablet per minute. LIBS can therefore offer a rapid means for process optimization, and a great aid to the formulation scientist in understanding the effect of lubricant blend uniformity on the overall quality of the process and the resulting product.
Similar results were found using a commercial LIBS unit designed to function in a GMP production environment as an at-line instrument. It was possible to demonstrate that the MgSt depth-profile distribution can reveal the type of manufacturing process used for tablets. Moreover, it was verified that the accuracy of the quantitation (based on the Mg signal) is improved when the standards are made with the same process as the samples. It can be expected that employing internal standardization in this case (e.g. using the Mg/C ratio), as in the case above, would further improve accuracy. Finally it was shown that, using the ability of LIBS to provide a local measurement, both faces of a tablet should be analyzed in order to obtain a better estimation of MgSt distribution. This could be particularly important to determine if one tablet face exhibits surface defects such as picking, or when film coating quality appears better on one tablet face than on the other.
§
REFERENCES
- Radziemski, L.J., Review of selected analytical applications of laser plasmas and laser ablation, 1987-1994. Microchem J, 50:218-234, 1994.
- Rusak, D.A.; Castle, B.C.; Smith, B.W.; Winefordner, J.D., Fundamentals and applications of laser-induced breakdown spectroscopy. Crit Rev Anal Chem, 27:257-290, 1997.
- Song, K.; Lee, Y.-I.; Sneddon, J., Recent developments in instrumentation for laser induced breakdown spectroscopy, Appl Spectrosc Rev, 37:89-117, 2002.
- Vadillo, J.M. and Laserna, J.J., Laser-induced plasma spectrometry: truly a surface analytical tool, Spectrochim Acta Part B, 59:147-161, 2004.
- Sabsabi, M. and Bussière, J., Method and apparatus for rapid in situ analysis of preselected components of homogeneous solid compositions, especially pharmaceutical compositions. US Patent 5,781,289 (July 14, 1998).
- Béchard, S., Targeting actives with elemental analysis. Pharmaceutical Formulation & Quality, 3:37-40, 2001.
- St-Onge, L.; Kwong, E.; Sabsabi, M.; Vadas, E.B., Quantitative analysis of pharmaceutical products by laser-induced breakdown spectroscopy. Spectrochim Acta Part B, 57:1131-1140, 2002.
- Mouget, Y.; Sing, R.; Béchard, S., Rapid determination of active drug, disintegrant and lubricant content in pharmaceutical tablets by laser-induced breakdown spectroscopy. PITTCON 2001 Proceedings, 2066P, 2001.
- Good, J.A.; Mowery, M.D.; Reed, R.A.; Rapid at-line determination of lubricant distribution in powder blends using laser induced breakdown spectroscopy (LIBS). AAPS PharmSci Suppl, 3(3):abstract #2344, 2001.
- Green, R.L.; Mowery, M.D.; Good, J.; Higgins, J.P.; Arrivo, S.M.; McColough, K.; Mateos, A.; Reed, R.A., Comparison of near-infrared and laser-induced breakdown spectroscopy for determination of magnesium stearate in pharmaceutical powders and solid dosage forms. Appl Spectrosc, 59:340-347, 2005.
- Mouget, Y.; Sing, R.; Béchard, S., The determination of coating thickness uniformity in pharmaceutical tablets by laser-induced breakdown spectroscopy. PITTCON 2001 Proceedings, 2067P, 2001.
- Mowery, M.D.; Sing, R.; Kirsch, J.; Razaghi, A.; Béchard, S.; Reed, R.A., Rapid at-line analysis of coating thickness and uniformity on solid dosage forms using laser induced breakdown spectroscopy. J. Pharm Biomed Anal, 28:935-943, 2002.
- St-Onge, L.; Kwong, E.; Sabsabi, M.; Vadas, E.B., Rapid analysis of liquid formulations containing sodium chloride using laser-induced breakdown spectroscopy. J Pharm Biomed Anal, 36:277-284, 2004.
- General chapter on Plasma Spectrochemistry. Pharmacopeial Forum, 30(3), 2004. http://www.fda.gov/cder/OPS/PAT.htm
- Shangraw, R.F.; Demarest, Jr., D.A., A survey of current industrial practices in the formulation and manufacture of tablets and capsules. Pharm Technol, 17:32-44, 1993.
- USP25/NF20, United States Pharmacopeial Convention, Inc., MD,
- Archambault, J.-F.; Vintiloìu, A.; Kwong, E., The effects of physical parameters on LIBS analysis of intact tablets AAPS PharmSciTech (accepted for publication).
- St-Onge, L.; Faustino, P.; Tourigny, M.; Sabsabi, M., Influence of manufacturing changes and formulation excipients on the direct determination of furosemide in solid oral dosage forms using laser-induced breakdown spectroscopy (LIBS), AAPS Journal, 6(4):abstract T3053, 2004.
Published by the Canadian Society for Pharmaceutical Sciences.
Copyright © 1998 by the Canadian
Society for Pharmaceutical Sciences.
http://www.cspscanada.org