J Pharm Pharmaceut Sci (www.cspscanada.org) 8(2):124-131, 2005
A sensitive and specific high performance liquid chromatographic assay for milrinone in rat and human plasma using a commercially available internal standard and low sample volume.
Dion R. Brocks1, Tara J. Spencer, Anooshirvan Shayeganpour
Faculty of Pharmacy and Pharmaceutical Sciences, University of Alberta, Edmonton, Alberta, CanadaReceived 31 January 2005, Revised 11 February 2005, Accepted 11 February 2005, Published 24 June 2005
Abstract
PURPOSE. To develop an alternate high performance liquid chromatographic method (HPLC) for the analysis of the positive inotropic agent, milrinone, in rat and human plasma. METHODS: To plasma samples (0.1 mL), containing milrinone and the commercially available internal standard, amrinone, were added 0.15 mL of water and 0.35 mL of acetonitrile. Tubes were briefly vortex-mixed and centrifuged. The supernatant was transferred to clean tubes and 3 mL of methanol: diethyl ether (5:95) was added. The tubes were vortex mixed, centrifuged, and reconstituted with the mobile phase and injected into the HPLC. Separation was accomplished using a reverse phase chromatography using C18 analytical column, and detection was afforded by monitoring the eluent at an ultraviolet wavelength of 326 nm. RESULTS : Standard curves were highly linear over the range 10 to 10000 ng/mL (r2 >0.99). Recovery ranged from 52-69% over a 40-fold range of plasma concentrations from 50 to 2000 ng/mL. Intra- and inter-day coefficient of variation and mean error in were less than 20% at plasma concentrations ranging from 10 to 1000 ng/mL. The utility of the assay was demonstrated in a pharmacokinetic evaluation of milrinone in two rats given intravenous bolus doses. CONCLUSION: The developed assay was sensitive, specific and appropriate for monitoring milrinone in rat or human plasma samples.
Introduction
Milrinone (1,6-dihydro-2-methyl-6-oxo-[3,4'-bipyridine]-5-carbonitrile) is a cardiovascular drug which possesses positive inotropic and potent vasodilating properties (1, 2).
The drug is a specific inhibitor of phosphodiesterase III, and exerts its pharmacological effect by increasing cyclic AMP (cAMP) levels in the heart and vascular smooth muscle, which causes an increase in contractility of heart muscle and reduction in peripheral vascular resistance (1, 2). Milrinone is commonly used following open heart surgery to prevent the occurrence of low cardiac output syndrome (3). Unlike other medications used for this purpose, such as catecholamines, milrinone affords an advantage in that it does not commonly cause increase heart rate or the risk of dysrhythmias, both of which could pose a risk of increased ventricular afterload (3). It has been used successfully following cardiovascular surgery in neonates, infants, children and adults (3-7). In addition, milrinone may be used to treat patients with congestive heart failure (8-11) or other critically ill patients (12, 13). The desired therapeutic plasma concentration of milrinone reportedly ranges from 100 to 400 ng/mL (7, 11).
High performance liquid chromatography with ultraviolet detection has been the approach of choice in measurement of milrinone in plasma samples for pharmacokinetic study.
To date, few assays (11, 13-16) have been developed to quantify plasma concentrations of milrinone (Table 1).
Table 1: Published HPLC assays for milrinone in plasma.
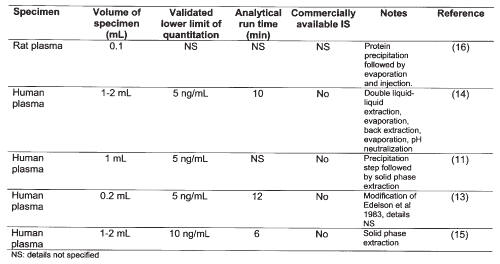
For study of the pharmacokinetics of the drug in young infants or children, or in pharmacokinetic studies in preclinical species such as the rat, minimization of specimen volume is a desirable feature. The current paper describes a new high-performance liquid chromatographic (HPLC) assay for milrinone in plasma that could be used in pharmacokinetic studies. The method has some benefits over previously published assays such as requirement for small volumes of plasma, a relatively simple liquid-liquid extraction method and use of a commercially available internal standard.
Materials and Methods
Materials
Milrinone lactate for injection and internal standard (IS), amrinone (5-amino [3,4'-bipyridine]-6(1H)-one) were obtained from Pharmaceutical Partners of Canada (Richmond Hill, ON, Canada) and Sigma (St. Louis, Missouri, USA), respectively. Methanol, acetonitrile, hexane, ethyl ether (all HPLC grades) were obtained from EM Science (Gibstacin, NY USA). Sodium phosphate (monobasic), sodium phosphate (dibasic), triethylamine and sulfuric acid were purchased from BDH (Toronto, ON, Canada).
Chromatographic Conditions
The chromatography system consisted of a Waters 712 WISP auto-injector, 610 Fluid unit, 600E system controller (Waters, Milford, MA, USA), and a HP 1012 UV detector (Hewlett Packard, Palo Alto, CA, USA). Chromatographic data were collected and compiled by use of EZChrom software (Scientific Software, Pleasanton, CA, USA). Chromatographic separation of milrinone and IS was facilitated using a 5 mM C18 15 cm x 4.6 mm reverse phase analytical column (Beckman Ultrasphere, Mississauga ON, Canada). A Guard-Pak Precolumn C18 module (Waters, Milford, MA, USA) was placed proximal to the analytical column. The mobile phase was a ternary mixture of [25 mM KH2 PO4 : 3 mM sulfuric acid: 3.6 mM triethylamine]: methanol: acetonitrile in the proportion 90:7:3 v/v, respectively. Prior to use the mobile phase was degassed by passing it through a 0.45 micron filter. The mobile phase was pumped at an isocratic flow rate of 1 mL/min at room temperature. The wavelength of UV detection was set at 326 nm.
Standard and Stock Solutions
The stock solution of the internal standard (amrinone) was prepared by dissolving 5 mg of amrinone in 100 mL of methanol. This stock solution was further diluted 5-fold in methanol, to permit a working solution of 10 mg/mL. The final stock solution of amrinone was stored at 4ºC between uses. The working solution of milrinone was made fresh each day by making a 1:9 dilution of milrinone lactate for injection in HPLC water. By serial dilution of this solution, calibration standards were made to produce final concentrations ranging from 10 to 2000 ng/mL, based on 100 mL of plasma.
Extraction Procedure
In a 1.5 mL polypropylene microcentrifuge tube, 100 mL of rat plasma was added along with 50 mL of internal standard (amrinone 10 mg/mL). For calibration standards, milrinone solution was added as appropriate. Because milrinone was added as an aqueous solution, to each tube was added 150 mL of water (including the volume of milrinone solution added). To each tube, 350 mL of acetonitrile was then added to precipitate plasma proteins. The tubes were then vortex mixed for 5 s and centrifuged at 3800 g for 3 min. Following centrifugation the supernatant was transferred by Pasteur pipette to clean glass test tubes (13×100 mm). To these tubes 3 mL of 95:5 diethyl ether: methanol was added. Each tube was then vortex mixed for 30 s and centrifuged at 3800 g for 3 min. The organic solvent layer was then transferred by Pasteur pipette to clean glass test tubes (10×75 mm) which were dried in vacuo. Each sample was then reconstituted with 150 mL of mobile phase and aliquots of 20-50 mL were injected into the HPLC.
Recovery
Known amounts of milrinone were added to rat plasma to provide concentrations of 50, 500 and 2000 ng/mL based on 100 mL of plasma. Internal standard was not added to the samples, but 50 mL of methanol was added in lieu of the internal standard solution. The samples were subjected to acetonitrile precipitation and extraction into 3 mL of diethyl ether: methanol (95:5) as described above. After centrifugation of the extraction solvent/deproteinated plasma mixture, a volume of 2 mL of the organic layer was carefully measured and transferred to clean tubes in which they were dried in vacuo . After adding 120 mL of mobile phase to the dried residues, known volumes were injected into the HPLC. The peak heights were compared to those of equal injection volumes of unextracted samples containing the same amounts of drug as added to the plasma in the extracted samples. For each concentration, 4 replicates were prepared for each of the unextracted and extracted samples.
Calibration and validation
Calibration curves containing milrinone and internal standard were constructed over the range 10 to 2000 ng/mL based on 100 mL of plasma. Due to the wide range of concentrations, data for calibration curves were weighted by a factor of 1/concentration2. Intraday accuracy and precision was determined using four different concentrations in rat plasma (10, 50, 200 and 500 ng/mL), with 5 replicates being used per concentration. This was repeated on 3 separate days to permit an assessment of interday accuracy and precision. Intraday accuracy and precision were also determined in human plasma at concentrations of 10, 25, 200 and 1000 ng/mL. For each daily run, a set of calibration samples separate from the validation samples was prepared to permit quantitation of the peak height ratios of milrinone to internal standard.
Precision was assessed by coefficient of variation, which was calculated as:
and
Bias was assessed by determining percent error, which was calculated as:
and
Rat pharmacokinetic study
In order to test the assay for its utility in a pharmacokinetic study, milrinone 2 mg/kg was injected as an intravenous bolus to two Sprague-Dawley rats, cannulated the day before the experiment in the right jugular vein as previously described (17). The procedures utilized in the animal study were approved by the University of Alberta Health Sciences Animal Policy and Welfare Committee.
Blood samples (200-300 mL) were collected at 0.083, 0.5, 1, 1.5, 2, 3, 4 and 6 h after administration of the dose. Blood was centrifuged for 3 min and the plasma was separate and stored at -20ºC until assayed. Calculation of area under the plasma concentration vs. time curve (AUC0-8) was determined using the combined log-linear method from time of dosing to last measured concentration, with the extrapolated AUC being calculated as last measured concentration divided by terminal phase rate constant. Clearance (CL) was calculated as the quotient of dose over AUC0-8. The volume of distribution at steady-state (Vdss) was calculated as the CL×MRT (mean residence time) (18). Both two and three compartment pharmacokinetic models with elimination from the central compartment were fitted to the plasma concentration vs. time profiles using a nonlinear curve fitting routine written in-house with Microsoft Excel 2003 (Redmond WA USA). The Solver routine in Excel was used to facilitate the fit. Relative goodness of fit was assessed using the Aikake Information Criterion.
ResultS
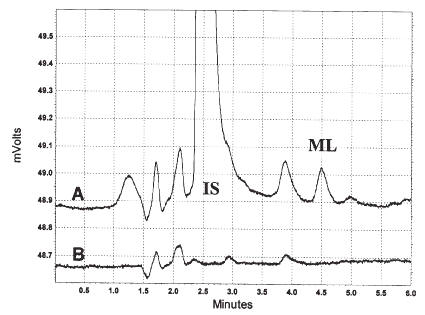
In both rat and human plasma, the retention times for milrinone and the internal standard were at approximately 4.8 and 2.5 min, respectively, from the time of injection, and each component eluted free of interfering substances (Figures 1 and 2).
The analytical run time was 6 min. Average extraction efficiencies for 100 mL plasma samples for concentrations of 50, 500 and 2000 ng/mL were 69.1, 57.6, and 51.8%, respectively.
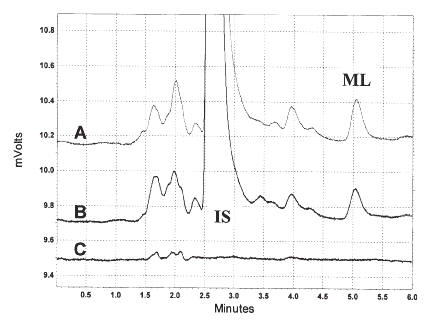
Figure 1: Chromatograms of milrinone and IS in rat plasma (A, 6 h post-dose; B, 125 ng/mL standard; C, blank).
Figure 2: Chromatograms of milrinone and IS in human plasma (A, 125 ng/mL standard; B, blank plasma).
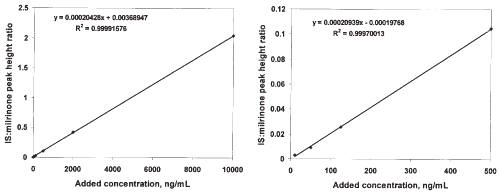
Highly linear relationships between peak height ratios and rat plasma concentration of drug were evident over the broad concentration range studied. Using the mean slope and intercept from a set of 5 standard curves prepared using rat plasma, the regression equation of peak height drug: IS ratio = concentration×0.000216 + 0.000866. The CV% of the slope and intercept were 11.7 and 94.4%, respectively. The mean r2 for the standard curves in the rat plasma was 0.9991±0.0008808. In one curve the range was extended from 10 to 10000 ng/mL, and linearity and the consistency of the slope was maintained across the range of concentrations (Figure 3).
Figure 3: A representative standard curve for milrinone in rat plasma extending from 10 to 10000 ng/mL (Panel A) and from the same standard curve, concentrations extending from 10 to 5000 ng/mL.
From the mean of slope and intercept a series of 4 standard curves prepared using human plasma, the regression equation was peak height drug: IS ratio = concentration×0.000217 + 0.000616. The CV% of the slope and intercept from this data were 5.56 and 68.0%, respectively. The mean r2 for the standard curves in the human plasma was 0.9999±0.00007989.
At all concentrations monitored, the assay coefficient of variation was less than 20% in all intraday and interday assessments in the rat (Table 2), and in the single day assessment in human plasma (Table 3).
Table 2: Validation data for milrinone in rat plasma. Five replicates per concentration were included for each intraday run.
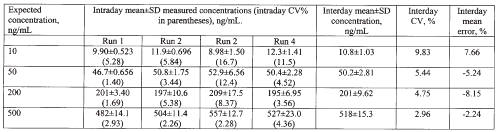
Table 3: Single day validation data for milrinone in human plasma.
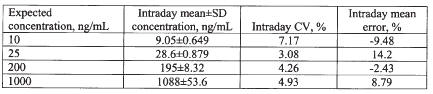
Mean intraday error in rat plasma, and intraday error in human plasma, were less than 10%. The lower limit of quantitation of the assay based on the mean error and CV% results was 10 ng/mL.
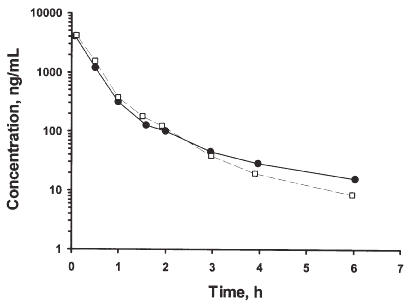
Plasma concentrations were successfully monitored for the 6 h collection period following administration of the intravenous bolus dose of 2 mg/kg (Figure 4).
Figure 4: Plasma concentration vs. time profiles of milrinone in two rats given 2 mg/kg intravenous bolus doses of the drug.
The plasma concentration vs. time profiles were very similar in both rats, and indicated multiphasic decline, with a 2 compartment model being fitted to the data more appropriately than a 3 compartment model. From the two rats, the mean CL, Vdss and terminal phase rate constant was 0.95 L/h/kg, 0.579 L/kg and 0.521 h-1, respectively.
Discussion
The assay was highly specific and sensitive for milrinone in both the rat and human plasma. The calibration curves were linear over a wide range of concentrations, and the assay procedure was associated with accuracy and precision measures which well conformed to guidelines proposed for bioanalytical assays (19). Based on the validation results (Tables 2 and 3), the lower limit of quantitation of milrinone by the assay was found to be 10 ng/mL based on 100 mL of plasma. This makes the assay well suited for use in pharmacokinetic studies in the rat, or for monitoring of milrinone plasma concentrations in young infants and children, in which minimization of blood sample volume would be desirable. It took less than 2 h to fully prepare a set of 36 plasma samples through the extraction and drying steps. Extraction efficiency was observed to fall from 50 to 2000 ng/mL, although from a quantitative perspective this did not have a deleterious impact on linearity or measures of validation (Tables 2 and 3, Figure 3). The protein precipitation step was found to afford greater recovery of the milrinone from plasma; direct extraction into ether without this step resulted in extraction efficiency of less than 35% at a concentration of 2000 ng/mL.
Most pharmacokinetic studies involving milrinone (3, 4, 6, 8-10, 13, 20, 21) have been performed using the method of Edelson et al. (14). In this method saturated ammonium sulfate solution is added, followed by a double extraction into ethyl acetate, evaporation of the combined ethyl acetate extracts, back extraction from ethyl acetate into dilute HCl, evaporation of residual ethyl acetate, then injection into the HPLC. Compared to the method described here, the more commonly used method (14) would appear to be more laborious and time consuming. It has one notable advantage over our method, however, in that extraction efficiency was reportedly excellent (~100%) at lower plasma concentrations (20-150 ng/mL based on 1 mL of sample) of milrinone. The authors did not report extraction efficiency beyond this range; in our recovery analysis we used a range from 50 to 2000 ng/mL, which is more in line with the range expected in rats given bolus doses (Figure 4). Nevertheless, although our extraction efficiency was lower, it did not affect the linearity of the standard curves over a wide range of concentration (Figure 3), nor did it affect the reproducibility of the assay (Tables 2 and 3), which was excellent. Although the lower limit of quantitation for milrinone is lower in the method of Edelson et al. (14) than in the current method (5 ng/mL vs. 10 ng/mL), the previous value is based on a much larger sample volume (1 mL vs. 0.1 mL). The lower limit of quantitation of the current method (10 ng/mL) is 10-fold lower than the cited minimal therapeutic plasma concentration of milrinone. One group has referred to a modification of more commonly used method (14) in which lower plasma volumes could be used with greater sensitivity (13), although details were not disclosed (Table 1).
A notable advantage of the current method over each of the previous methods (Table 1) is that it uses a commercially available internal standard that is readily available. It would be unexpected for amrinone to be coadministered with milrinone because they both share the same basic mechanism of action and pharmacological effects. Hence it is unlikely that interfering amrinone peaks would be present in chromatograms of patient plasma samples.
Pharmacokinetic data was obtainable in the rat samples that were assayed. In the two rats studied, pharmacokinetic estimates of CL, Vdss and terminal phase rate constant were calculated. We were able to quantify the concentrations for 6 h from the time of dosing in conscious rats. In the only published study examining the pharmacokinetics of the drug in rats, concentrations were only measured for 90 min post-dose due to the sampling design employed (16). In that study the animals were anaesthetized and apparently did not survive longer than 90 min. Those authors required 150 mL of plasma for assay of milrinone, and validation data were not provided (16). Because we only performed our pharmacokinetic evaluation to test the ability of the assay for use in a pharmacokinetic study, and only two animals given a single dose level were assessed, definitive comparisons between the pharmacokinetics of milrinone from previous work cannot be made. However, it does appear that the terminal phase half-life obtained in the previous study (16) was shorter than what we have determined, and might be expected due to the sampling duration in the previous study and the compartmental nature of the course of decline in plasma concentrations vs. time (Figure 4).
In conclusion, a new HPLC method was developed which permitted quantitation of milrinone at concentrations as low as 10 ng/mL, based on 100 mL of rat or human plasma. The method was linear and reproducible over a wide range of plasma concentrations, and was shown to be of use in performing pharmacokinetic studies of milrinone in the rat.
Acknowledgements
TJS was supported by a Rx&D HRF/CIHR Summer Research Studentship in Pharmacy.
References
Lehtonen, L. A., Antila, S., and Pentikainen, P. J. Pharmacokinetics and pharmacodynamics of intravenous inotropic agents. Clin Pharmacokinet, 43: 187-203 2004.
Ooi, H. and Colucci, W. S. Pharmacological treatment of heart failure. Chapter 34. In J. G. Hardman, L. E. Limbird, and A. Goodman Gilman (eds), Goodman and Gilman's the Pharmacological Basis of Therapeutics, Tenth edition (J. G. Hardman, L. E. Limbird, and A. Goodman Gilman, eds), McGraw-Hill, New York, 2001, pp. 901-932.
Bailey, J. M., Hoffman, T. M., Wessel, D. L., Nelson, D. P., Atz, A. M., Chang, A. C., Kulik, T. J., Spray, T. L., Akbary, A., Miller, R. P., and Wernovsky, G. A population pharmacokinetic analysis of milrinone in pediatric patients after cardiac surgery. J Pharmacokinet Pharmacodyn, 31: 43-59 2004.
Bailey, J. M., Levy, J. H., Kikura, M., Szlam, F., and Hug, C. C., Jr. Pharmacokinetics of intravenous milrinone in patients undergoing cardiac surgery. Anesthesiology, 81: 616-22 1994.
Bailey, J. M., Miller, B. E., Lu, W., Tosone, S. R., Kanter, K. R., and Tam, V. K. The pharmacokinetics of milrinone in pediatric patients after cardiac surgery. Anesthesiology, 90: 1012-8 1999.
Butterworth, J. F. t., Hines, R. L., Royster, R. L., and James, R. L. A pharmacokinetic and pharmacodynamic evaluation of milrinone in adults undergoing cardiac surgery. Anesth Analg, 81: 783-92 1995.
Ramamoorthy, C., Anderson, G. D., Williams, G. D., and Lynn, A. M. Pharmacokinetics and side effects of milrinone in infants and children after open heart surgery. Anesth Analg, 86: 283-9 1998.
Benotti, J. R., Lesko, L. J., McCue, J. E., and Alpert, J. S. Pharmacokinetics and pharmacodynamics of milrinone in chronic congestive heart failure. Am J Cardiol, 56: 685-9 1985.
Edelson, J., Stroshane, R., Benziger, D. P., Cody, R., Benotti, J., Hood, W. B., Jr., Chatterjee, K., Luczkowec, C., Krebs, C., and Schwartz, R. Pharmacokinetics of the bipyridines amrinone and milrinone. Circulation, 73: III145-52 1986.
Taniguchi, T., Shibata, K., Saito, S., Matsumoto, H., and Okeie, K. Pharmacokinetics of milrinone in patients with congestive heart failure during continuous venovenous hemofiltration. Intensive Care Med, 26: 1089-93 2000.
Woolfrey, S. G., Hegbrant, J., Thysell, H., Fox, P. A., Lendrem, D. W., Lockwood, G. F., Lasher, K., Rogers, J., and Greenslade, D. Dose regimen adjustment for milrinone in congestive heart failure patients with moderate and severe renal failure. J Pharm Pharmacol, 47: 651-5 1995.
Barton, P., Garcia, J., Kouatli, A., Kitchen, L., Zorka, A., Lindsay, C., Lawless, S., and Giroir, B. Hemodynamic effects of i.v. milrinone lactate in pediatric patients with septic shock. A prospective, double-blinded, randomized, placebo-controlled, interventional study. Chest, 109: 1302-12 1996.
Lindsay, C. A., Barton, P., Lawless, S., Kitchen, L., Zorka, A., Garcia, J., Kouatli, A., and Giroir, B. Pharmacokinetics and pharmacodynamics of milrinone lactate in pediatric patients with septic shock. J Pediatr, 132: 329-34 1998.
Edelson, J., Koss, R. F., Baker, J. F., and Park, G. B. High-performance liquid chromatographic analysis of milrinone in plasma and urine. Intravenous pharmacokinetics in the dog. J Chromatogr, 276: 456-62 1983.
Oddie, C. J., Jackman, G. P., and Bobik, A. Analysis of milrinone in plasma using solid-phase extraction and high-performance liquid chromatography. J Chromatogr, 374: 209-14 1986.
Verrijk, R., Vleeming, W., van Rooij, H. H., Wemer, J., and Porsius, A. J. Plasma elimination of milrinone in rats in relation to its hemodynamic effects. J Pharm Sci, 79: 236-9 1990.
Brocks, D. R. Stereoselective pharmacokinetics of desbutylhalofantrine, a metabolite of halofantrine, in the rat after administration of the racemic metabolite or parent drug. Biopharm Drug Dispos, 21: 365-71 2000.
Gibaldi, M. and Perrier, D. Pharmacokinetics, Dekker, New York, 1982.
Shah, V. P., Midha, K. K., Dighe, S., McGilveray, I. J., Skelly, J. P., Yacobi, A., Layloff, T., Viswanathan, C. T., Cook, C. E., McDowall, R. D., and et al. Analytical methods validation: bioavailability, bioequivalence and pharmacokinetic studies. Conference report. Eur J Drug Metab Pharmacokinet, 16: 249-55 1991.
Prielipp, R. C., MacGregor, D. A., Butterworth, J. F. t., Meredith, J. W., Levy, J. H., Wood, K. E., and Coursin, D. B. Pharmacodynamics and pharmacokinetics of milrinone administration to increase oxygen delivery in critically ill patients. Chest, 109: 1291-301 1996.
Stroshane, R. M., Koss, R. F., Biddlecome, C. E., Luczkowec, C., and Edelson, J. Oral and intravenous pharmacokinetics of milrinone in human volunteers. J Pharm Sci, 73: 1438-41 1984.
Corresponding Author: Dion R. Brocks, Associate Professor, Faculty of Pharmacy and Pharmaceutical Sciences, 3118 Dentistry/Pharmacy Centre, University of Alberta, Edmonton, Alberta, Canada, T6G 2N8. dbrocks@pharmacy.ualberta.ca http://www.pharmacy.ualberta.ca/brocks.htm
Published by the Canadian Society for Pharmaceutical Sciences.
Copyright © 1998 by the Canadian Society for Pharmaceutical Sciences.
http://www.cspscanada.org