J Pharm Pharmaceut Sci (www.ualberta.ca/~csps) 7(3):345-349, 2004
A pilot study to evaluate the pharmacokinetics of sibutramine in healthy subjects under fasting and fed conditions.
Zohreh Abolfathi1, Jean Couture, François Vallée, Marc LeBel, Mario Tanguay, Éric Masson
SFBC Anapharm, Québec, CanadaReceived 16 June 2004, Revised 7 October 2004, Accepted 21 October 2004, Published 12 November 2004
PDF Version
Abstract
PURPOSE: The purpose of this study was to characterize the food effect on the pharmacokinetics of sibutramine and its pharmacologically active metabolites. METHODS. This was an open label, single dose, crossover study completed by six healthy males. A single dose of sibutramine 15 mg was administered orally under fasting and fed conditions. Plasma concentrations of sibutramine and its metabolites were determined by LC/MS/MS. Non-compartmental pharmacokinetics and statistical analysis were performed using SAS. RESULTS. The food intake increased significantly AUCs and Cmax of sibutramine and its M1 metabolite, but did not affect M2 metabolite. When sibutramine was administered with food, the Tmax was delayed by 2 to 4 hours for sibutramine, M1 and M2 metabolites as stated in the literature. CONCLUSONS. The results of this study indicate that sibutramine is measurable using a sensitive bioanalytical method. In contrast with what is reported in the product monograph, this study demonstrated that the bioavailability of sibutramine and M1 metabolite was significantly increased with administration with food. The results confirmed lack of food effect on the pharmacokinetics of M2 metabolite. These relatively large food effect observed for sibutramine and M1 metabolite, could have implication for the efficacy and safety of the drug.
Introduction
Sibutramine is a b-phenylethylamine (1) indicated for the management of obesity, including weight loss and maintenance of weight loss, and should be used in conjunction with a reduced calorie diet. It is recommended for obese patients with an initial body mass index (BMI) > 30 or > 27 in the presence of other risk factors (e.g. hypertension, diabetes, dyslipidemia) (1, 2). The recommended starting dose of sibutramine is 10 mg once daily, and the maximum daily dose is 15 mg (2). In humans, sibutramine is rapidly metabolized, to desmethyl metabolites, M1 (mono-desmethyl sibutramine) and M2 (di-desmethyl sibutramine) (3). No pharmacokinetic data for the parent drug, sibutramine has been previously reported in the literature. A sensitive assay had to be developed in order to characterize the pharmacokinetics of sibutramine. It has been reported that sibutramine exerts its pharmacological actions predominantly via its secondary amine M1 and primary amine M2 metabolites, although sibutramine is also pharmacologically active. The Canadian product monograph states that administration of a single 20 mg dose of sibutramine with a standard breakfast results in reduced M1 and M2 concentrations (by 27% and 32%, respectively) and delays the time to peak by approximately 3 hours. However, it was reported that the AUCs of M1 and M2 were not significantly altered. The purpose of this study was to characterize the pharmacokinetics of sibutramine and its two active metabolites with and without a high-fat meal.
Material and Methods
Study Design
Six healthy (aged between 24 and 59 years old), adult, male non-smokers participated in this pilot, single dose, open-label, and one sequence crossover study. All subjects met the inclusion and exclusion criteria described in the protocol and were judged eligible for the study, based on medical history, demographic data, medication history, physical examination, vital signs and clinical laboratory tests and urinanalysis. The study was conducted in accordance with internationally accepted standards of Good Clinical Practices (ICH), Good Laboratory Practices, local regulatory requirements, and the principles enunciated in the Declaration of Helsinki (Edinburgh, Scotland, 2000). In period 1, subjects were administered sibutramine hydrochloride (Meridia®, Abbott Laboratories Limited, Canada) as a 1 x 15 mg capsule, after an overnight fast of at least 10 hours. In period 2, after a supervised overnight fast of at least 10 hours, and within 30 minutes before drug administration, subjects were served a standard high-fat, high-caloric breakfast of approximately 1000 calories (with 50% of calories from fat). A washout period of 14 days separated the two periods. Blood samples were drawn at pre-dose and at 0.167, 0.333, 0.500, 0.667, 0.833, 1.00, 1.50, 2.00, 2.50, 3.00, 3.50, 4.00, 6.00, 8.00, 12.0, 16.0, 24.0, 36.0, 48.0, and 72.0 hours post-dose in each period. Plasma was harvested from each blood sample and stored in a -80°C (-85°C to -65°C) freezer, pending assay for sibutramine and its metabolites.
Analytical Method
Plasma concentrations of sibutramine, M1 and M2 metabolites were measured by LC/MS/MS method according to the following method: Sibutramine and its M1 and M2 metabolites were measured in human heparin plasma using liquid chromatography with tandem mass spectrometry detection. Separation of sibutramine and its metabolites was achieved on a Zorbax C18 column. Plasma samples were spiked with a deuterated internal standard (sibutramine-d7), then extracted with methyl-ter-butyl ether, evaporated under nitrogen and reconstituted in acetonitrile/ammonium acetate. The calibration curves ranged from 50.50 to 25250 pg/mL for sibutramine, from 100.20 to 50100 pg/mL and from 99.00 pg/mL to 49500 pg/mL for M1 and M2, respectively. Inter- and intra-batch coefficients of variation ranged from 1.96 to 11.10% for sibutramine, from 1.85 to 4.08% and from 2.43 to 8.73% for M1 and M2 metabolites, respectively.
Pharmacokinetic Analysis
Pharmacokinetic parameters were calculated using non-compartmental methods. Cmax, the maximum observed concentration, and Tmax, the time of observed peak concentration, were determined for each subject and for each treatment. AUC0-t, the area under the plasma concentration-time curve from time zero to the time of the last non-zero concentration was calculated using the linear trapezoidal rule. The AUC0-inf, the area under the concentration-time curve from time zero to infinity (extrapolated) was calculated as AUC0-t, + Ct/Kel, where: Ct = the last non-zero observed concentration. To calculate the elimination rate constant (Kel ), regression analyses were performed on the natural log (Ln) of plasma concentration values (y) versus time (x). The Kel was taken as the slope multiplied by (-1) and the apparent half-life (T1/2 el) as (ln 2)/Kel.
Statistical analysis
Comparison of fed and fasted study periods were accomplished using ANOVA performed on ln-transformed data of AUC0-t, AUC0-inf and Cmax. Probability (p) values were derived from Type III sums of squares. The ratio of least-squares means (fed/fasted) was also calculated according to the formula "e (X-Y) x 100".
RESULTS
Six male subjects completed the study. All oral doses were well tolerated by the subjects, and no adverse events were reported.
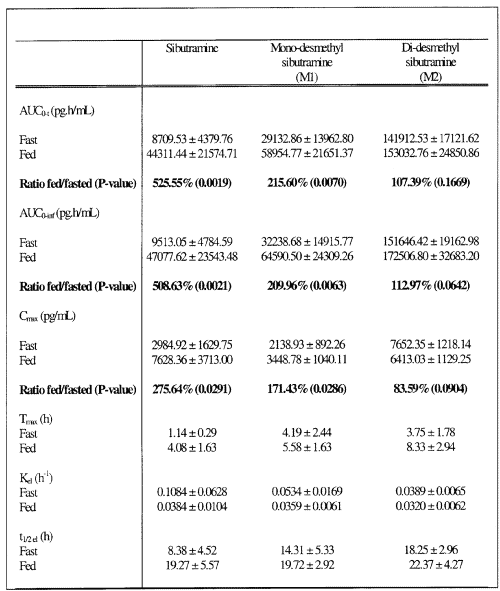
A summary of pharmacokinetic parameters is provided in Table I for sibutramine and its M1 and M2 metabolites.
Table 1: Pharmacokinetic parameters of sibutramine and its M1 and M2 metabolites after a single 15 mg oral dose of sibutramine HCl to 6 healthy volunteers under fasting and fed conditions (Mean ± SD).
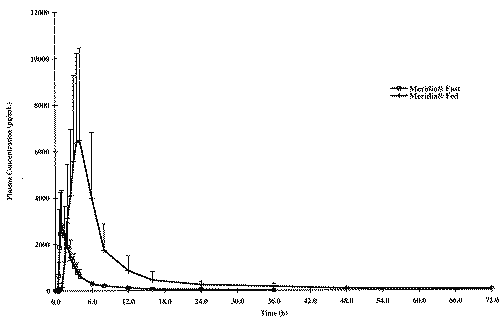
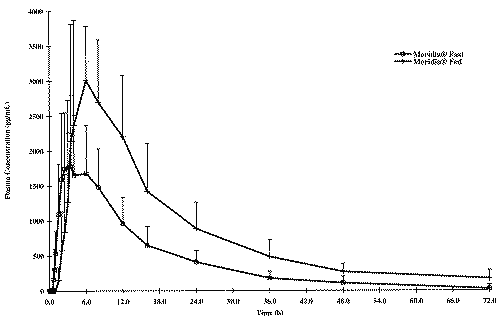
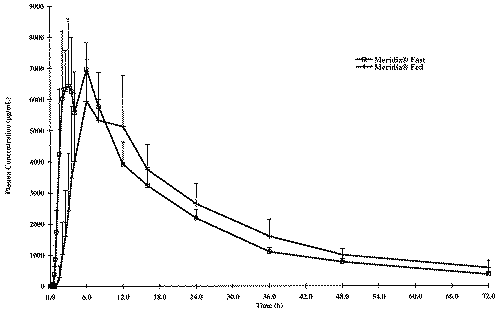
Mean plasma concentration-time curves for the fasted and fed study are illustrated in Figures 1, 2 and 3, respectively for sibutramine and its M1 and M2 metabolites.
Figure 1: Concentration - Time profile of the Mean Sibutramine.
Figure 2: Concentration - Time profile of the Mean Mono-Desmethyl-Sibutramine.
Figure 3: Concentration - Time profile of the Mean Di-Desmethyl-Sibutramine.
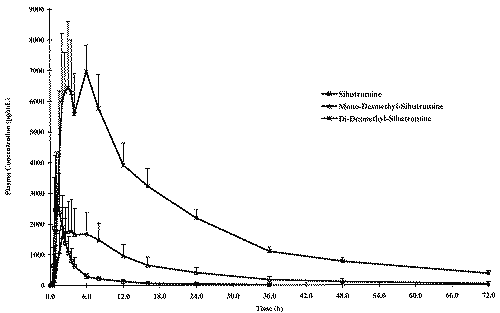
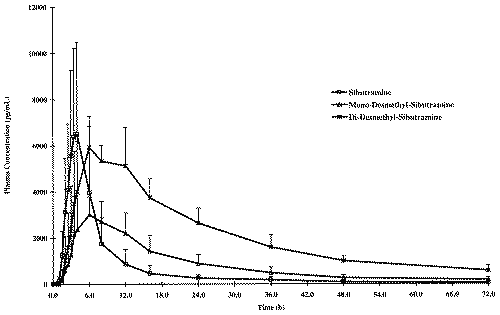
Figure 4 presents the mean plasma profiles of sibutramine and its metabolites under fasting conditions while these profiles are displayed in Figure 5 under fed conditions.
Figure 4: Concentration - Time profile of the Mean Fasting Conditions.
Figure 5: Concentration - Time profile of the Mean Fed Conditions.
The food intake increased significantly AUCs and Cmax of sibutramine and its M1 metabolite; a five and three fold increase in AUCs and Cmax, respectively was observed for sibutramine and approximately two-fold increase for both parameters for M1 metabolite when the drug was administered with food. However, neither AUCs nor Cmax differed significantly between fasted and fed study periods for M2 metabolite. When administered with food, the time to peak plasma concentration was delayed by approximately 2 to 4 hours for sibutramine, M1 and M2 metabolites as reported in the literature. There was also a significant increase in elimination half-life of sibutramine following food intake. The elimination half-life calculated for sibutramine, M1 and M2 metabolites was 8 h, 14 h and 18 h respectively under fasting conditions and was between 20 h to 22 h for all analytes under fed conditions.
Discussion and Conclusion
To date detection of sibutramine in plasma has been challenging (4). However, detection and characterization of its metabolites (M1 and M2) have been performed by high-performance liquid chromatography (HPLC)-electrospray ionization tandem mass spectrometry (MS-MS) (4). Use of a sensitive and specific LC/MS/MS method in this study allowed a better characterization of the pharmacokinetic profile of sibutramine as well as M1 and M2 metabolites.
Sibutramine Canadian product monograph states that administration of a single 20 mg dose of sibutramine with a standard breakfast resulted in reduced peak M1 and M2 concentrations (by 27% and 32%, respectively) and delayed the time to peak by approximately 3 hours. However, the AUCs of M1 and M2 were not reported to be significantly altered. In contrast with what is reported in the product monograph, the current study demonstrated that a high fat meal increased significantly the peak concentration and AUC of sibutramine and M1 metabolite. However, Cmax and AUC of M2 metabolite were not significantly altered by food.
Food may affect the pharmacokinetics of drugs by different ways, including delayed gastric emptying, solubilisation of drug by food and digestive fluids, complexation of drug with food components, alteration in hepatic blood flow and modulation of drug-metabolizing enzymes by constituents of food (5). In addition, food intake has been found to influence the bioavailability of drugs with extensive presystemic metabolic clearance (6). Sibutramine undergoes extensive first-pass metabolism in the liver. It is metabolized in the liver principally by CYP3A4 isoenzyme to desmethyl metabolites M1 and M2 (2). CYP3A4 is expressed in large quantities in both the liver and the gut wall, (7-9) and appears to be involved in both systemic and presystemic metabolism (10). Concurrent food intake reduces presystemic clearance, and thus enhances bioavailability, of several lipophilic bases such as propranolol, metoprolol, labetalol, dixyrazine and hydralazine, which are presystemically metabolized by hydroxylation, glucuronidation and acetylation enzymes systems. In contrast, the bioavailability of lipophilic bases that undergo presystemic dealkylation (amitriptyline, codeine, dextropropoxyphene, prazosin, zimelidine) is reported not to be affected by concurrent food intake (6). Sibutramine (cyclobutanemethanamine) is a lipophilic base, which undergoes presystemic dealkylation. In contrast to what is reported for other lipophilic bases with similar metabolic pathways (6), food intake enhanced bioavailability of sibutramine in this study.
It has been reported (6) that food intake reduces presystemic clearance of hydralazine and propranolol when these drugs are administered in conventional rapid-release tablets but not when they are given in slow-release formulations. This observation favors the view that food may reduce presystemic clearance of certain lipophilic basic drugs via transient, complex effects on splanchnic-hepatic blood flow and/or shunt processes, and that the extent of this effect is influenced by the rate of drug delivery to the liver. The fact that peak plasma concentration of sibutramine was increased to approximately the same extent as AUC despite the delay in Tmax, supports the hypothesis that the ability of meal to increase oral bioavailability of sibutramine, may be due to transient increases in liver blood flow.
In this study, there was a significant increase in elimination half-life of sibutramine following food intake. This increase may be explained by a better characterization of the terminal elimination phase due to the higher concentrations observed under fed conditions. Longer half-life was also observed for sibutramine in this study as compared with data from the literature. This may also be due to the more sensitive assay used in this study. Therefore, the longer half-life values observed for sibutramine under fed conditions should not be related to a decrease in sibutramine's metabolism. This is supported by the fact that lower primary metabolite (M1) concentrations would be expected if sibutramine's metabolism was decreased by food intake. In our study, however, there was approximately a two-fold increase of M1 metabolite AUC.
In conclusion, the results of this study showed that bioavailabilty of sibutramine and M1 metabolite was increased under fed conditions. In the light of recent safety reports (11), these results may provide additional information to health professionals concerning the safety of sibutramine. However, additional studies with more subjects and after multiple administrations may be warranted.
References
Medical Economics Company. The information standard for prescription drugs. PDR Generics. 55th ed. Montvale, New Jersey, USA: 2002.
Canadian Pharmacists Association. Compendium of Pharmaceuticals and Specialties. Ottawa, Canada: 2002.
Hind, ID, Mangham, JE, Ghani, SP, Haddock, RE, Garratt CJ and Jones RW, Sibutramine Pharmacokinetics in Young and Elderly Healthy Subjects. 1999; Eur J Clin Pharmacol 54: 847-9
Chen J, Lu W, Zhang Q and Jiang X, Determination of the active metabolite of sibutramine by liquid chromatography-electrospray ionization tandem mass spectrometry. J Chromatogr B Analyt Technol Biomed Life Sci 2003, 785 (2): 197-203
Harris RZ, Jang GR, and Tsunoda S, Dietary effects on drug metabolism and transport. Clin Pharmacokinet 2003; 42 (13): 1071-1088
Melander A and McLean A, Influence of food intake on presystemic clearance of drugs. Clin Pharmacokinet 1983; 8 (4): 286-96
Hall SD, Thummel KE, Watkins PB, et al. Molecular and physical mechanisms of first-pass extraction. Drug Metab Dispos 1999; 27 (2): 161-6
Kolars JC, Lown KS, Schmiedlin-Ren P, et al. CYP3A gene expression in human gut epithelium. Pharmacogenetics 1994; 4 (5): 247-59
Watkins PB. Drug metabolism by cytochromes P450 in the liver and small bowel. Gastroenterol Clin North Am 1992; 21 (3): 511-26
Gorski JC, Jones DR, Haehner-Daniels BD, et al. The contribution of intestinal and hepatic CYP3A to the interaction between midazolam and clarithromycin. Clin Pharmacol Ther 1998; 64 (2): 133-43
Bosello, O., Carruba, M.O., Ferrannini, E. and Rotella, C.M., Sibutramine lost and found. Eating Weight Disord. 2002; 7: 161-167
Corresponding Author: Zohreh Abolfathi, SFBC Anapharm, 2050, boul. René-Lévesque Ouest, Québec (Québec), Canada G1V 2K8. zabolfathi@anapharm.com
Published by the Canadian Society for Pharmaceutical Sciences.
Copyright © 1998 by the Canadian Society for Pharmaceutical Sciences.
http://www.ualberta.ca/~csps
