J Pharm Pharmaceut Sci (www.ualberta.ca/~csps) 7(2):186-199, 2004
A new topological descriptors based model for predicting intestinal epithelial transport of drugs in caco-2 cell culture.
Yovani Marrero Ponce1, Miguel A. Cabrera Pérez, Vicente Romero Zaldivar, Humberto González Díaz, Francisco Torrens
Department of Pharmacy, Faculty of Chemical-Pharmacy. Central University of Las Villas, Santa Clara, Villa Clara, Cuba; Department of Drug Design, Chemical Bioactive Center. Central University of Las Villas, Santa Clara, Villa Clara, Cuba; Faculty of Informatics. University of Cienfuegos, Cienfuegos, Cuba; Institut Universitari de Ciència Molecular, Universitat de València, Burjassot (València), SpainReceived 20 February 2004, Revised 26 March 2004, Accepted 14 April 2004, Published 29June 2004
PDF Version
Abstract
PURPOSE: Quantitative Structure-Permeability Relationships (QSPerR) of the intestinal permeability across the (Caco-2) cells monolayer could be obtained by the application of new molecular descriptors. METHOD: A novel topologic-molecular approach to computer molecular design ( TOMOCOMD-CARDD ) has been used to estimate the intestinal-epithelial transport of drug in Caco-2 cell culture. RESULTS: The Permeability Coefficients in Caco-2 cells (P) for 33 structurally diverse drugs were well described using quadratic indices of the molecular pseudograph's atom adjacency matrix as molecular descriptors. A quantitative model that discriminates the high-absorption compounds from those with moderate-poor absorption was obtained for the training data set, showing a global classification of 87.87%. In addition, two QSPerR models, through a multiple linear regression, were obtained to predict the P [apical to basolateral (AP→BL) and basolateral to apical (BL→AP)]. A leave- n -out and leave- one -out cross-validation procedure revealed that the discriminant and regression models respectively, had a good predictability. Furthermore, others 18 drugs were selected as a test set in order to assess the predictive power of the models and the accuracy of the final prediction was similar to achieve for the data set. Besides, the use of both regression models, in a combinative way, is possible to predict the Permeability Directional Ratio (PDR, BL→AP/AP→BL) value. The found models were used in virtual screening of drug intestinal permeability and a relationship between calculated P and percentage of human intestinal absorption for several compounds was established. Furthermore, this approximation permits us to obtain a good explanation of the experiment based on the molecular structural features. CONCLUSIONS: These results suggest that the proposed method is able to predict the P values and it proved to be a good tool for studying the oral absorption of drug candidates during the drug development process.
Introduction
The estimation of human oral absorption of new drug candidates in the early stage of the drug discovery process is a useful tool in the lead-compound selection (1-2). Several in vitro approaches, based on cell cultures, have been used in this area over the last few years. Among the cell culture models, the Caco-2 cell line is the most widely employed and it has been investigated like a potential in vitro model for drug absorption and metabolism studies (3-4). In this sense, considering the similarity of Caco-2 cell with the small intestine enterocytes and their capacity to express carrier-mediated transport systems and typical small intestinal enzymes (3-4), the permeability coefficient across Caco-2 cell monolayer (P) is increasingly used to estimate the oral absorption of new chemical entities (5-7).
Nevertheless, the permeability of compounds that are transported via carrier-mediated absorption is lower than that obtained through the human small intestine. In addition, these carcinoma colon cells have poor permeability for hydrophilic compounds, which can pass through this barrier by paracellular route (through the intercellular space) (8). Furthermore, due to cancerous origin of this cell line, they over-express the P-glycoprotein with the consequently lower permeability's in the absorptive direction (9). Finally, the long culture period with the consequent high-research cost and the difficulty to extrapolate these in vitro results with the in vivo situation are considered as main practical limitations.
In order to accelerate the growing of Caco-2 cell monolayer a rapid culture system has been used (P accelerate ) (10).
On the other hand, the theoretical approach appears to be a good alternative to prediction of human absorption for new drug candidates obtained by combinatorial chemistry methodologies (11-13), avoiding significant failure in late stage of the drug-discovery process (14). In the last few years, graph-theoretical methods have become one of the most important tools for quantifying molecular structure. These theoretical strategies have emerged as a promising solution to the efficient search of new lead compounds (15) and it has been very useful to elucidate quantitative structure-property (QSPR) and quantitative structure-activity (QSAR) relationships. Trying to demonstrate the importance and relevance of the theoretical methods in the determination of the drugs absorption, the main objectives of the present work were, to find a quantitative model that discriminates, within the data set, the high-absorption compounds from those with moderate-poor absorption; and to develop quantitative relationships between the structure, expressed by the quadratic indices of the molecular pseudograph's atom adjacency matrix (16-18), and the P in both membrane directions, using a multiple linear regression method. Finally, to use both obtained models on virtual screening of drug intestinal permeability.
Theoretical Approach
The general principles of the quadratic indices of the "molecular pseudograph`s atom adjacent matrix" for small-to-medium sized organic compounds have been explained in some detail elsewhere (17, 18). However, an overview of this approach will be given.
The molecular vector (X) is constructed in order to calculate the molecular quadratic indices for a molecule where the components of this vector are numeric values, which represent a certain atomic property. These properties characterize each kind atom within the molecule. Such properties can be the electronegativity, density, atomic radii, and so on.
If a molecule consists of n atoms ( vector of Ân ), then the k th total quadratic indices, qk(x) are calculated as a quadratic form ( q:Ân→Â ) in canonical basis as shown in Eq. 1,
(1)
where, kaij = kaji (symmetric square matrix), n is the number of atoms of the molecule and X1,...,Xn are the coordinates of the molecular vector (X) in a system of basis vectors of the Ân. One can choose the basis vectors the coordinates of the same vector will be different. The values of the coordinates depend thus in an essential way on the choice of the basis. The so-called canonical (' natural ') bases, ej denote the n- tuple having 1 in the jth position and 0's elsewhere. In the canonical bases, the coordinates of any vector X coincide with the components of this vector. For that reason, those coordinates can be considered as weights (atom-labels) of the vertices of the pseudograph.
The coefficients kaij are the elements of the kth power of the matrix M (G) of the molecular pseudograph (G). Here, M (G) = M = [ aij ], denote the matrix of qk(x) with respect to the natural basis. In this matrix n is the number of vertices (atoms) of G and the elements aij are defined as follows:
(2)
where, E(G) represents the set of edges of G. Pij is the number of edges between vertices vi y vj and Lii is the number of loops in vi.
Given that aij = Pij, the elements aij of this matrix represent the number of bonds between an atom i and other j . The matrix Mk provides the number of walks of length k that links the vertices vi and vj. For this reason, each edge in M1 represents 2 electrons belonging to the covalent bond between atoms (vertices) vi and vj ; e.g. the inputs of M1 are equal to 1, 2 or 3 when appears simple, double or triple bonds between vertices vi and vj , respectively. On the other hand, molecules containing aromatic rings with more than one canonical structure are represented like a pseudograph. It happens for substituted aromatic compounds such as pyridine, naphthalene, quinoline, and so on, where the presence PI(π) electrons is accounted by means of loops in each atom of the aromatic ring. Conversely, aromatic rings having only one canonical structure, such as furan, thiophene and pyrrol are represented like a multigraph.
On the other hand, the defining equation (1) for qk(x) may be written as the single matrix equation:
(3)
or in the more compact form,
(4)
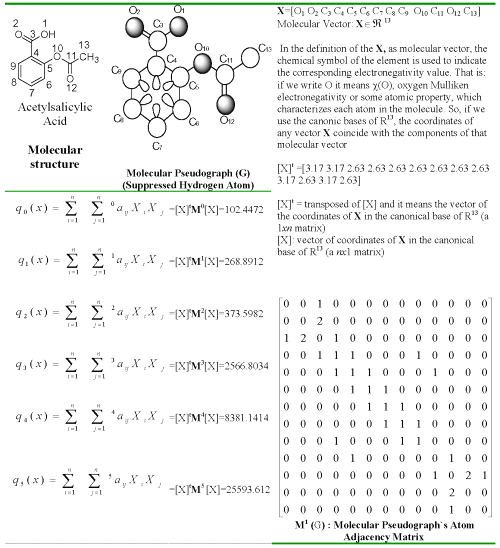
where [X] is a column vector (a nx 1 matrix) of the coordinates of X in the canonical base of Ân , [X] t the transpose of [X] (a 1 xn matrix) and Mk the kth power of the matrix M of the molecular pseudograph G (mathematical quadratic form's matrix). In Table 1, the calculation of six quadratic indices for acetylsalicylic acid is exemplified.
Table 1: Definition and calculation of six (k = 0-5) total quadratic indices of the molecular pseudograph's atom adjacency matrix of the molecule of acetylsalicylic acid.
In addition to a total quadratic indices computed for the whole-molecule a local-fragment (atom and atom-type) formalism can be developed. These descriptors are termed local quadratic indices of the "molecular pseudograph´s atom adjacency matrix", qkL(x) . The qkL(x) are graph-theoretical invariant for a given fragment FR (connected subgraph) within a specific pseudograph G. The definition of these descriptors is as follows:
(5)
where m is the number of atoms of the fragment of interest and kaijL is the element of the file "i" and column "j" of the matrix MkL= Mk(G, FR) [qkL(x) = qk(x, FR)] . This matrix is extracted from the Mk matrix and contains the information referred to the vertices of the specific molecular fragments (FR) and of the molecular environment.
The matrix MkL= [kaijL] with elements kaijL is defined as follows:
(6)
with the kaij being the elements of the kth power of M. These local analogues can also be expressed in matrix form by the expression:
(7)
Note that for every partitioning of a molecule into Z molecular fragment there will be Z local molecular fragment matrices. That is to say, if a molecule is partitioned into Z molecular fragments, the matrix Mk can be partitioned into Z local matrices MkL, L = 1,... Z and the kth power of matrix M is exactly the sum of the kth power of the local (`molecular fragment') Z matrices,
(8)
or in the same way as Mk = [kaij] where,
(9)
and the total quadratic indices is the sum in the quadratic indices of the Z molecular fragments,
(10)
Any local quadratic index has a particular meaning, especially for the first values of k , where the information about the structure of the fragment FR is contained.
High values of k are in relation with the environment information of the fragment FR considered inside the molecular pseudograph (G).
Atom and atom-type quadratic indices are specific case of local quadratic indices (for FR = atom or atom-type). In this sense, the kth atom-type quadratic indices are calculated by summing the kth atom quadratic indices of all atoms of the same atom type in the molecule.
In the atom-type quadratic indices formalism, each atom in the molecule is classified into an atom-type (fragment), such as heteroatoms, heteroatoms H-bonding acceptor (O, N and S), halogens, aliphatic carbon chain, aromatic atoms (aromatic rings), an so on. For all data sets, including those with a common molecular scaffold as well as those with very diverse structure, the kth atom-type quadratic indices provide much useful information.
In any case, whether a complete series of indices is considered, a specific characterization of the chemical structure is obtained (whole structure or fragment), which is not repeated in any other molecule. The generalization of the matrices and descriptors to "superior analogues" is necessary for the evaluation of situations where only one descriptor is unable to bring a good structural characterization (19). These local indices can also be used together with total indices as variables of QSAR and QSPerR models for properties or activities that depend more on a region or a fragment than on the whole molecule.
Methods
TOMOCOMD-CARDD Approach
TOMOCOMD is an interactive program for molecular design and bioinformatics research (16-18). The program is composed by four subprograms, each one of them dealing with drawing structures (drawing mode) and calculating 2D and 3D molecular descriptors (calculation mode). The modules are named CARDD (Computed-Aided `Rational' Drug Design), CAMPS (Computed-Aided Modelling in Protein Science), CANAR (Computed-Aided Nucleic Acid Research) and CABPD (Computed-Aided Bio-Polymers Docking). In this paper, we outline salient features concerned with only one of these subprograms: CARDD. This subprogram was developed based on a user-friendly philosophy without prior knowledge of programming skills.
The calculation of total and local quadratic indices for any organic molecule (or any drug-like compounds) was implemented in the TOMOCOMD-CARDD software (16). The main steps for the application of this method in QSAR/QSPerR can be briefly resumed as follows:
Draw the molecular pseudographs for each molecule of the data set, using the software-drawing mode. This procedure is carried out by a selection of the active atom symbol belonging to different groups of the periodic table,
Use appropriated atom weights in order to differentiate the molecular atoms. In this work, we used as atomic property the Mulliken electronegativity (20) for each kind of atom,
Compute the total and local quadratic indices of the molecular pseudograph's atom adjacency matrix. They can be carried out in the software calculation mode, which you can select the atomic properties and the family descriptor previously to calculate the molecular indices. This software generate a table in which the rows correspond to the compounds and columns correspond to the total and local quadratic indices or any others family molecular descriptors implemented in this program,
Find a QSPerR/QSAR equation by using statistical techniques, such as multilinear regression analysis (MRA), Neural Networks (NN), Linear Discrimination Analysis (LDA), and so on. That is to say, we can find a quantitative relation between P values and the quadratic indices having, for instance, the following appearance,
(11)
where * qk(x) [or qkL(x)] is the kth total [or local] quadratic indices, and the ak's are the coefficients obtained by the linear regression analysis.
Test the robustness and predictive power of the QSPerR/QSAR equation by using internal and external cross-validation techniques,
Develop a structural interpretation of obtained QSPerR/QSAR model using quadratic indices as molecular descriptors.
The descriptors used in order to achieve the theoretical models were the following:
(1) qk(x) and qkH(x) are the kth total quadratic indices calculated using the kth power of the matrices [Mk (G)] of the molecular pseudograph (G) considering and not considering hydrogen atoms respectively.
(2) EqkL(x) [or EqkLH(x)], AqkL(x) [or AqkLH(x)] and Hqkk(x) are the kth local quadratic indices calculated using a kth power of the local matrices [MkL(G, Fi)] of the molecular pseudograph (G) not considering (or considering) hydrogen atoms for heteroatoms (S, N, O), aromatic systems and hydrogen-bonding heteroatoms (S, N, O), respectively.
Permeability Data
The experimental data set, used in the present study, was composed by 33 structurally diverse drugs, which were experimentally studied by Liang et al (21).
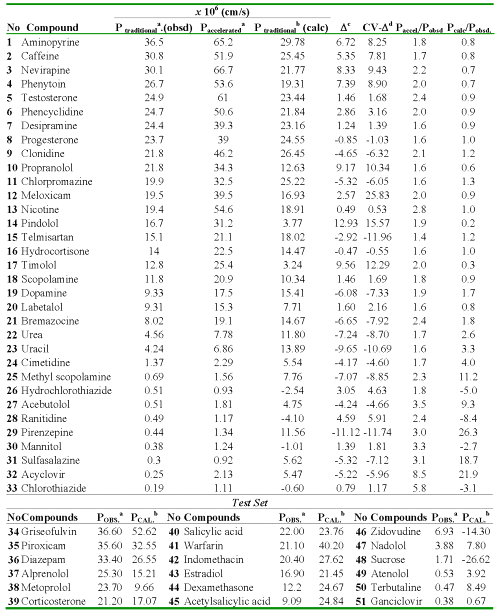
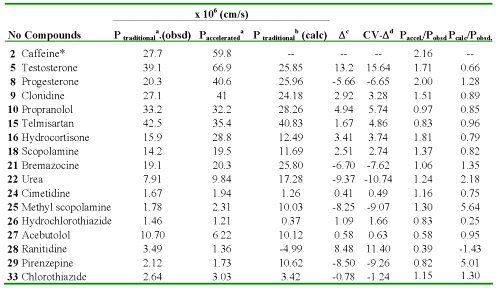
These authors used a traditionally and accelerate Caco-2 cell permeability model and the experimental values of P (AP→BL) and P (BL→AP) are depicted in Tables 2 y 3, respectively.
The P values of the test set of 18 drugs were taken from a study developed by Yazdanian and co-workers (6).
The compounds used by Liang et al. were taken from reference 6. Both studies were carried out under the same experimental conditions. The selected data set for `in silico' permeability studies included model compounds with absorption by paracellular and transcellular diffusion, carrier-mediated absorption as well as substrates for carrier-mediated secretion via P-glycoprotein.
These compounds had a molecular weight between 60 and 515 amu and their molecular charge was variable at pH 7.4 (6).
Statistical Analysis
All statistical analyses were developed with the STATISTICA 5.5 (22). The classification analysis was done using the Linear Discriminant Analysis ( LDA ). The quality of the model was determined examining the statistics parameter of multivariable comparison of the regression and by the cross-validation procedure (leave- n -out). The classification trees module was used to carry out leave- n -out cross validation procedures.
The linear multiple regression analysis ( LMR ) was developed to obtain the quantitative models between chemical structure and P values determined by traditional and accelerated methods.
The statistics quality of these models was evaluated taking into consideration the statistics graphics, the statistics parameters of multivariable comparison of the regression and the cross-validation procedure (leave- one -out).
Table 2: Experimental (traditional or accelerated model) and calculated values of the Caco-2 cell permeability coefficients (AP→BL) of 33 compounds as well as residuals of the regression and cross-validation.
aFrom Ref. (21). bCalculated with the Eq. (13). cResidual, defined as Ptraditional (obsd) - Ptraditional (calc). dResidual of the cross-validation.
Table 3: Experimental (by either traditional or accelerated model) and calculated values of the Caco-2 cell permeability coefficients (BL→AP) of 17 compounds as well as residuals of the regression and cross-validation.
*Outlier. aFrom Ref. (21). bCalculated with the Eq. (14). cResidual, defined as Ptraditional. (obsd) - Ptraditional (calc). dResidual of the cross-validation.
Results and Discussion
Developing the Discrimination Function
Linear discriminant analysis (LDA) was employed with the aim of developing a function that discriminates between high and moderate-poor absorbed compounds. For this purpose, this data set was split into two subsets according to the quantitative value of P (AP→BL) (23): the first group was composed by 18 compounds (high-absorption group; P (AP→BL) ≥ 10x10 -6 cm/s) and the second one by 15 compounds with moderate-poor absorption (P (AP→BL) < 10x10- 6 cm/s). The range selection for permeability coefficient in Caco-2 cells is a bottleneck whether a correlation with the human absorption is searched. Several classification methods have been described in the literature, (6, 24-26) where the inter-laboratory and experimental variability is considered. Nevertheless, if all the approaches reported in the literature are analyzed, it can be stated that a value of P greater than 10x10 -6 cm/s will classify good-absorption compounds (70-100%). Taking into consideration the reported selection approaches, a second group with moderate-poor absorption (<10x10 -6 cm/s) was selected, although in this range a high variability is appreciated when the human oral absorption is predicted from the P values (6, 24-26).
From a practical perspective the established boundary, assure that classified compounds have a good absorption profile. The best classification model found, by a forward-stepwise variable selection procedure, together with the statistical parameters, is shown below:
(12)
where, N is the number of compounds, λ is Wilks´ coefficient, F is the Fisher ratio, D 2 is the squared Mahalanobis distance and p -value is the significance level. The Wilks´ λ parameter for overall discrimination can take values in the range of 0 (perfect discrimination) to 1 (no discrimination). The Mahalanobis distance indicates the separation between the respective groups. This model classified correctly 80.00% of compounds with moderate-poor absorption properties and a 94.44% of compounds with high absorption. The global classification for the data set was 87.87%. Only four compounds were classified bad, one of them with high absorption was classified as a moderate-poor absorption drug (3.03%, false negative compound) and three belonging to the moderate-poor absorption group were classified as high-absorption drugs (9.09%, false positive compounds).
From a practical point of view and in the development of the classifier model, the prediction of false negatives is considered more important because they are compounds that will be rejected for their poor predicted intestinal absorptions and therefore they will never be evaluated experimentally, and their true absorption would never be discovered. On the contrary, the false positive compounds eventually will be detected.
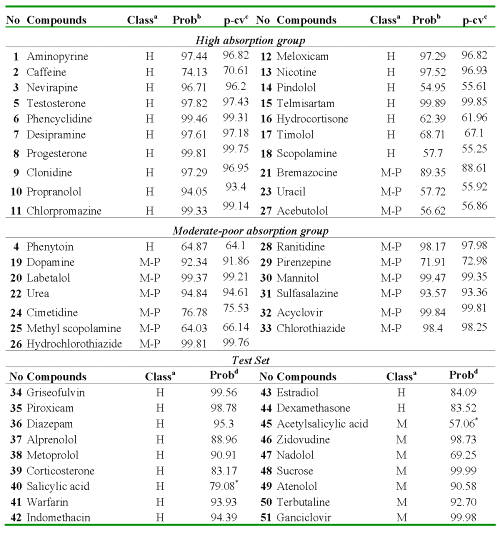
In Table 4 are shown the results of classification and a posteriori probabilities for the 33 compounds of the data set.
The predictability of the model obtained by LDA was assessed through a leave-one-out (LOO) cross-validation procedure. In this methodology, the model was built after removing one compound and the resulting model was used to predict the property of the one removed. This was repeated to obtain a prediction for every compound. Using this approach, the model classified correctly 80.00% and 94.44% of compounds from the training set that belong to the moderate-poor and high-absorption group, respectively. The global classification of the cross-validation was 87.87%.
Table 4: Results of Compounds Classification for the Data and External Prediction Set (AP→BL).
aObserved classification: H (high-absorption group) and M-P (moderate-poor absorption group). bProbability calculated. cProbability calculated LOO cross-validation. dProbability calculated for the test set. *Misclassified Compounds for the test set.
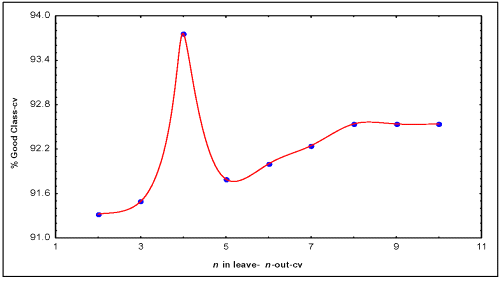
For a more exhaustive testing of the predictive power of the found model a leave- n -out (LnO) cross validation procedures was carried out using the classification tree module (22). The selected conditions for the validation procedure were discriminant-based linear combination as split method, prune on misclassification error as stopping rule and the same prior probabilities than in Eq. 12. Once the selected conditions are applied in the classification trees' module, Eq. 12 is obtained and a L n O procedure can be developed varying the folding parameter of the cross validation. This model shown a 91.3, 91.5, 93.8, 91.8, 92.0 and 92.2% of good global classification when n varied from 2 to 7 respectively in the L n O cross validation procedures.
The model was stabilized around 92.5% when n was > 7 (see Figure 1).
In addition, to assess the predictive power of the model an external prediction set of 18 drugs was used, where the percentage of good global classification was 88.88%. If we considered the data set and the test set together ( full set) the percentage of good classification was 88.23%. At the bottom of Table 4 appear the obtained results for the external prediction set. As it can be seen, in both series, the predictability and robustness of the theoretical model was demonstrated.
Figure 1: Result obtained to assess the predictive power of the discrimination model (Eq. 12) using L n O Cross-Validation procedure. The model (Eq. 12) was stabilized around 92.5% when n was > 7.
From the full data set, only 6 compounds were classified badly. Two drugs (salicylic acid and phenytoin) were classified as false negative and four as false positive compounds (bremazocine, uracil, acebutolol and Acetylsalicylic acid). The high percentage of misclassified compounds belongs to the moderate-poor absorption group. In this set, they were included compounds with P values lower than 10x10 -6 . This is a logic result due to the fact that in this group there are some compounds with high variability in relation to the human absorption values and it is not always possible an extrapolation between human absorption and the P values (P < 10); for example a drug like acebutolol (P = 0.51) has a 90% of human absorption (27). In addition, others compounds such as acetylsalicylic acid (P = 9.09) and bremazocine (P = 8.02) have P values close to the selected limit value (10x10 -6 ) and in the first case the low percentage of classification (57.06%) can be explained when the human absorption value is considered (100%) (6).
The Regression Models
With the aim of predicting the P values, we develop two quantitative models that relate the quadratic indices of the molecules with the P (AP→BL) and P (BL→AP). The best linear regression models for P were obtained by a forward stepwise procedure; the equation and the statistical parameters are shown below:
(13)
(14)
where, R is the multiple regression coefficient, s the standard deviation of the regression, sCV are the standard deviation of the LOO cross-validation procedure; F is the Fisher ratio at the 95% confidence level and p -value is the significance level.
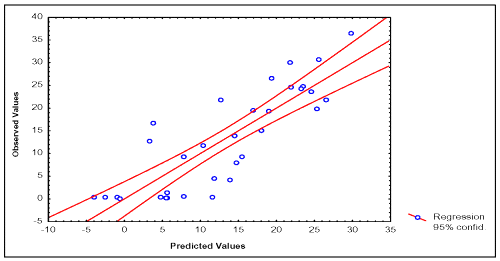
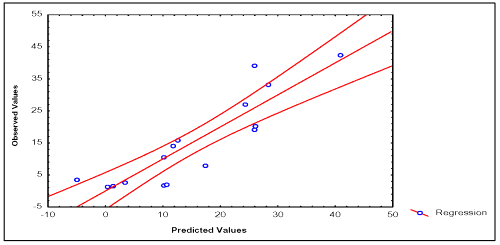
In Tables 2 and 3, the values of experimental and calculated permeability coefficients for the data set are given, and in the Figures 2 and 3, the existing linear relationships between them are depicted. In the development of the quantitative model for description of P (BL →AP) of the data set, one compound was detected as statistical outliers (Caffeine). Outliers' detection was carried out by using the following standard statistical tests: residual, standardized residuals, studentized residual and Cooks' distance (28).
Figure 2: Correlation between experimental and calculated P (AP→BL) values of 33 compounds of the data set.
Figure 3: Correlation between experimental and calculated P (BL→AP) values of 16 compounds of the data set. Caffeine was detected as statistical outlier. For this reason, this compound was excluded of the statistical analysis.
Several researchers have explored QSPerR involving Caco-2 cell permeability. In these studies, some types of molecular descriptors have been introduced, where size and hydrogen-bonding descriptors (13), polar surface area (PSA) (8, 29, 30), Molsurf-derived descriptors (31), MO-calculation (11) and using membrane-interaction analysis (32) are included. These QSPerR models have predicted the P values with a reasonable accuracy, although the numbers of compounds in the data sets have been limited. For example, Fujiwara et al . considered quadratic and interactive terms (11) in the equations and the correlation coefficients were 0.74 and 0.76, respectively. In the same paper, these authors increased the correlation coefficient up to 0.790 using a neural network. In addition, van de Waterbeemd et al. obtained an R-value for P between 0.513 and 0.884 (13). In other paper, Ren and Lien (33) developed a QSAR analysis where an adequate regression coefficient value, for the same data set of 51 compounds used in this study, was obtained (0.79). Finally, in a recently study developed by Kulkarni et al. (32), about prediction of P values, 6 predictive models were obtained using Multidimensional Linear Regression (MLR) and the R values were between 0.86 and 0.92; but in this case only 74% from the original data set (6) was chosen.
Interpretation of QSPerR Models
Up to now, it is known that the absorption is influenced by a different kind of interactions. Several studies have demonstrated that the permeability coefficient, measured by a transport through Caco-2 monolayer cell cultures, is correlated with lipophilicity (6, 12, 13, 33), while others emphasize on the role of hydrogen-bonding capacity or charge (7, 8, 12, 13). A paradigm of structure-permeability relationship has been expressed as (13):
(15)
As it can be observed, in the discriminant and the regression models, the included variables are very close to the factors that influence on the P values. These factors are related with the structural features of molecules. For example in Eq. 12, the variables Hq2L(x), Hq4L(x) and Hq7L(x) are connected with the hydrogen atoms as donors, while the Eq1LH(x) and Eq3LH(x) variables contain information about the number of hydrogen acceptors and the charge of molecules. All of them are related with the total hydrogen bond capacity. P negatively depends on these descriptors. The values of these molecular indices increase with the rise of the numbers of heteroatoms and the hydrogen bond to heteroatoms in the molecules. For this reason, we can say that these molecular descriptors have a negative contribution to P. These are a logical results because increasing the number of heteroatoms and the hydrogen bound to heteroatoms in the molecules decrease the permeability across the biological membrane. This effect is rather close to the molecular lipophilicity decrease and the possibility of the molecule of ionization and to obtain a charge. The charge factor is related with the negative charge of the biological membrane (34). This observation is supported by a study developed by Ren et al., where the same full set used in the present study. First, a low regression coefficient (R = 0.749) was evidenced when anionic, cationic and neutral compounds (the full set), were studied using the net charge of molecules like a descriptor. When these compounds where divided into three subgroups, namely neutral, cationic and anionic compounds, much better correlation coefficients (R = 0.968, 0.915 and 0.931, respectively) were obtained (33).
Other descriptor with a positive contribution to the discriminant function is q0.q0(x) . This variable contains information about the molecular weight and consequently of the size of molecules. For this reason, although, the number of heteroatoms is increased (negative contribution to the permeability coefficient) the quadratic influence of molecular size (descriptor) should increase the permeability of molecules. In addition, these properties (molecular weight, size), H-bonding and charge are components of lipophilicity (13). For each property there are limited ranges as it is established in the Rule- of- 5 (1), but anyone is independent (35).
Taking into consideration the above mentioned approach it should be considered that successful drug candidates will be characterized by an optimal range of values for H-bonding, lipophilicity and size (36) and for this reason, compounds with extreme positive values of these properties could have a marked negative effect on permeability across the biological membrane (13).
As it can be seen, in the case of the linear regression model there are some influences of the local and the total descriptor of different orders, in similar way to the classification function. In the Eq.13, it appears the variable Aq14L(x) that indicates the presence and size of aromatic systems. In order to describe the P (AP→BL) and P (BL→AP) the descriptors selected by the regression process, in both equations, were different. This fact suggests that the transport process is different in two directions, explaining that some compounds are potential substrate of cellular efflux pumps (21). During the last few years, the Caco-2 cell model has been used to evaluate whether new chemical entities have possible cellular efflux pumps. For compounds that are cellular efflux pump substrates the P (BL→AP) value will be higher than P (AP→BL) (21) and for compounds that are not substrates the ratio between this two values should be near to 1. This ratio is called the Permeability Directional Ratio (PDR, BL→AP/ AP→BL). For this reason through the use of both regression models, in a combinative way, it is possible to predict the PDR value. This theoretical approach appears like a new alternative to the study of cellular efflux pump.
Virtual Screening and Correlation with ` in vivo ' Data
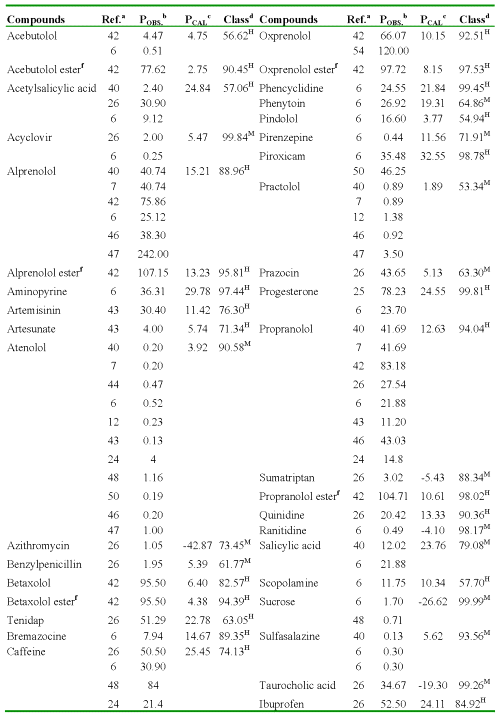
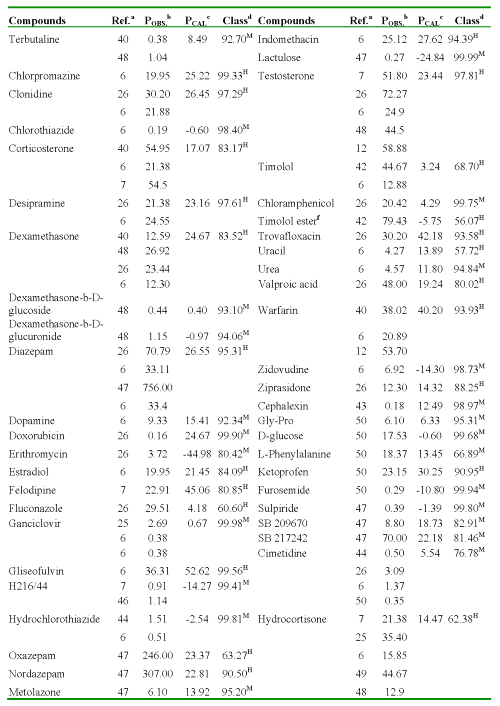
One of the most important aspects of any quantitative structure-permeability model is its ability to predict the studied P for any compound not included in the data (or training) set. Virtual screening has emerged as an interesting alternative to the handling and screening of large databases in order to find a reduced set of new potential drug candidates (37-39). In the present study, we simulated a virtual search of P (AP→BL) values by using the discriminant function (Eq. 12) and regression equation (Eq. 13) obtained through the TOMOCOMD-CARDD approach. In Table 5, the Caco-2 cell permeability data for 134 structurally diverse compounds, obtained from different sources are summarized (32, 33, 40-50). Sometimes they were obtained P experimental values from two or more sources, existing significant variability in these values. Several researchers have demonstrated inter-laboratory differences for Caco-2 cell permeability studies (8, 51).
The evaluation results of these compounds are given in Table 5.
Table 5: Result of the Virtual Screening for 134 Structurally Diverse Compounds.
|
aReferences where were collected the P values. bPermeability coefficient: P (AP→BL) x10-6cm/s, obtained from literature. cPermeability coefficient: P (AP→BL) x10-6cm/s, obtained using regression model (Eq. 13). dClassification and probability obtained using discriminant function (Eq. 12): H [high-absorption group (P (AP→BL) ≥ 10x10-6cm/s)] and M [moderate-poor absorption group (P (AP→BL) < 10x10-6cm/s)]. fO-cyclopropane carboxylic acid ester.
As can be seen in this Table, most of the 134 evaluated compounds are adequately predicted, although it should be considered that collected data are influenced by variations in cell culture conditions such as passage number, type of medium, day in culture, as well as the experimental conditions used for their measurement.
It is obvious that from the results the quality of the predictions corroborates the predictive power of the models found and justified their use in the prediction of this important property. Besides, this is not a fortuitous result due to the data set used in this study including absorption model compounds such as drugs with paracellular passive absorption (e.g. atenolol, furosemide, mannitol, terbutaline), transcellular passive absorption (e.g. antipyrine, ketoprofen, metoprolol, piroxicam), active transport processes (carrier-mediated up-take, e.g. Gly-Pro and L-phenylalanine) and carried mediated secretion via P-glycoprotein (e.g. talinolol, cimetidine, acebutolol, ranitidine, chlorothiazide).
On the other hand, the "in silico" estimated intestinal permeability could be used as a predictor of the true fraction of the absorbed drug.
The theoretical relationship between the fraction of drug absorbed (Fa) and permeability has been described by Amidon et al. (52):
(16)
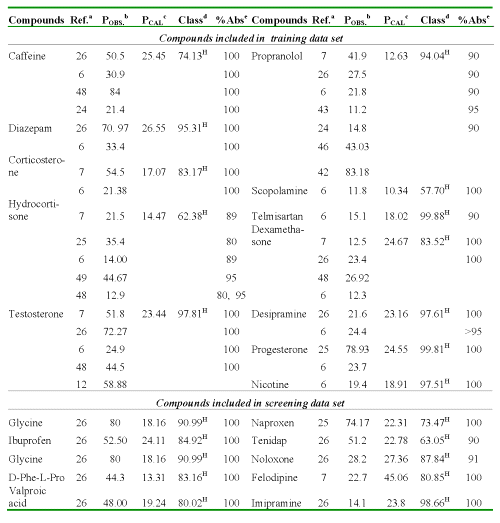
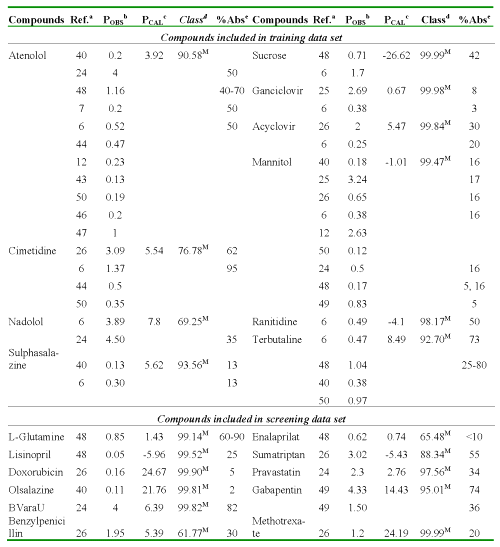
When the absorbed dose fraction, from human studies, is compared with the predictive P, a good relationship between the theoretical and observed values is obtained.
The following Table 6 a, b demonstrates this relation for several compounds used in the study.
Table 6: a Caco-2 cell permeability coefficients calculate using discriminant and regression models and percent GI absorption in human from the different reports for compounds with high absorption.
Table 6: b Caco-2 cell permeability coefficients calculate using discriminant and regression models and percent GI absorption in human from the different reports for compounds with moderate-poor absorption.
aReferences where were collected the P values. bPermeability coefficient: P (AP→BL) x10-6cm/s, obtained from literature. cPermeability coefficient: P (AP→BL) x10-6cm/s, obtained using regression model (Eq. 13). dClassification and probability obtained using discriminant function (Eq. 12): H [high-absorption group (P (AP→BL) ≥ 10x10-6cm/s)] and M [moderate-poor absorption group (P (AP→BL) < 10x10-6cm/s)]. eHuman fraction absorbed.
Conclusions
The total and local quadratic indices appear to be a promising structural invariant. Using these molecular indices and statistical techniques, a function discriminant that allows the correct classification of 87.87% of the compounds in the data set was developed. Using multiple regressions, two QSPerR models were obtained for the description and determination of P (AP→BL) and P (BL→AP) transport across monolayer of intestinal epithelial (Caco-2) cell. A LnO and LOO cross-validation procedure revealed that the discriminant and regression models respectively, had a fairly good predictability. Furthermore, other 18 drugs were selected as a test set (external prediction set) in order to assess the predictive power of the models. The P values of the test-set compounds were predicted with the same accuracy as the compounds of the data set. The use of both regression models, in a combinative way, is possible to predict the Permeability Directional Ratio (PDR, BL→AP/ AP→BL) value. The obtained models were used in virtual screening for drug intestinal permeability obtaining good relation with in vivo human absorption data. The `in silico' methodology, used in this study, shows how to provide an excellent alternative to the experimental models for rank-ordering compounds by reducing time and cost. Moreover, this approximation permits us to obtain significant interpretation of the experiment result in terms of the structural features of molecules. The application of the present method to the prediction of pharmacokinetic properties for several classes of organic compounds is now in progress and will be the subject of a future publication.
Acknowledgements
We sincerely thank Drs. Eric J. Lien, Mehran Yazdanian, A. J. Hopfinger, Mitsuru Hashida and Han van de Waterbeemd for providing some manuscript reprints from their works, which significantly contribute to the development of this paper. In addition, the authors thank the anonymous referees for their useful comments, which contributed to an improved presentation of these results.
References
[1] Lipinski C.A.; Lombardo, F.; Dominy, B.W.; Feeney, P.J., Experimental and computational approaches to estimate solubility and permeability in drug discovery and development settings. Adv Drug Deliv Rev, 23:3-25, 1997.
[2] Anonymous, Waiver of in vivo bioavailability and bioequivalence studies for immediate-release solid oral dosage forms based on a biopharmaceutics classification system. 2000. Available from http://www.fda.gov/cder/OPS/BCS_guidance.htm
[3] Artusson, P., Cell cultures as models for drug absorption across the intestinal mucosa. Crit Rev Ther Carrier Syst, 8:305-330, 1991.
[4] Quaroni, A.; Hochman, J., Development of intestinal cell culture models for drug transport and metabolism studies. Abv Drug Deliv Rev, 22:3-52, 1996.
[5] Hidalgo, I. J.; Raub, T.J.; Borchardt, R.T., Characterization of the human colon carcinoma cell line (Caco-2) as a model system for intestinal permeability. Gastroenterology, 96:736-749, 1989.
[6] Yazdanian, M.; Glynn, S.L.; Wright, J.L.; Hawi, A., Correlating partitioning and Caco-2 cell permeability of structurally diverse small molecular weight compounds. Pharm Res, 15:1490-1494, 1998.
[7] Artursson, P.; Karlsson, J., Correlation between oral drug permeability coefficients in human intestinal epithelial (Caco-2) cells. Biochem Biophys Res Commun, 175:880-885, 1991.
[8] Artursson, P.; Palm, K.; Luthman, K., Caco-2 monolayer in experimental and theoretical predictions of drug transport. Abv Drug Deliv Rev, 22:67-84, 1996.
[9] Anderle, P.; Niederer, E.; Rubas, W.; Hilgendorf, C.; Spahn-Langguth, P., P-glycoprotein (P-gp) mediated efluxx in caco-2 cell monolayers: The influence of culturing condition and drug exposure on P-gp expression levels. J Pharm Sci, 87:757-762, 1998.
[10] Lentz, K., Hayashi, J.; Polli, J.E., Development of a more rapid culture system for Caco-2 monolayers. Pharm Sci. 1:S456, 1998.
[11] Fujiwara, S.I.; Yamashita, F.; Hashida, M., Prediction of Caco-2 cell permeability using a combination of MO-calculation and neural network. Int J. Pharm, 237:95-105, 2002.
[12] Camenisch, G.; Alsenz, J.; van de Waterbeemd, H.; Folkers, G., Estimation of permeability by passive diffusion through Caco-2 cell monolayer using the drugs´ lipophilicity and molecular weight. Eur J Pharm Sci, 6:313-319, 1998.
[13] van de Waterbeemd, H.; Camenisch, G., Estimation of Caco-2 cell permeability using calculated molecular descriptors. Quant Struct-Act Relat, 15:480-490, 1996.
[14] Clark, E.; Pickett, D. S., Computational methods for the prediction of drug-likeness'. Drug Disc Today. 5:49-58, 2000.
[15] Ruovray, D., Taking a short cut to drug design. New Sci, 35-38, 1993.
[16] Marrero, Y.; Romero, V. TOMOCOMD software, version 1.0, 2002, Central University of Las Villas. TOMOCOMD (TOpological MOlecular COMputer Design) for Windows, version 1.0 is a preliminary experimental version; in future a professional version will be obtained upon request to Y. Marrero: yovanimp@qf.uclv.edu.cu or ymarrero77@yahoo.es
[17] Marrero, Y., Quadratic indices of the “molecular pseudograph`s atom adjacency matrix”. Total and local definition and applications to the prediction of physical properties of organic compounds. Molecules, 8:687-726, 2003. http://www.mdpi.org
[18] Marrero, Y.; Cabrera, M.A.; Siverio, D.; Romero, V.; Ofori, E.; Montero, L. A. Total and local quadratic indices of the “molecular pseudograph’s atom adjacency matrix”. Application to prediction of caco-2 permeability of drugs. Int. J. Mol. Sci, 4:512-536, 2003. www.mdpi.org/ijms/
[19] Randić, M., Generalized molecular descriptors. J Math Chem, 7:155-168, 1991.
[20] Cotton, F. A., Advanced Inorganic Chemistry, Ed Revolucionaria, Havana, Cuba, 1970.
[21] Liang, E.; Chessic, K.; Yazdanian, M., Evaluation of an accelerated caco-2 cell permeability model. J Pharm Sci, 89:336-345, 2000.
[22] STATISTICA version. 5.5, StatSoft, Inc. 1999.
[23] Chaturveldi, P.R.; Deker, C.J.; Odinecs, A. Prediction of pharmacokinetic properties using experimental approaches during early drug discovery. Curr Opin Chem Biol, 5:452-463, 2001.
[24] Chong, S.; Dando, S.A.; Morrison, R. Evaluation of biocoat intestinal epithelium differentiation environment (accelerated cultured caco-2 cells) as an absorption-screening model with improved productivity. Pharm Res, 14:1835-1837, 1997.
[25] Rubas, W.; Jezyk, N.; Grass, G.M. Comparison of the permeability characteristics of a human colonic epithelial (Caco-2) cell line to colon of rabbit, monkey and dog intestine and human drug absorption. Pharm Res, 10:113-118, 1993.
[26] Yee, S. In vitro permeability across caco-2 cells (colonic) can predict in vivo (small intestinal) absorption in man-fact or myth. Pharm Res, 14:763-766, 1997.
[27] Jack, D.B. Handbook of Clinical Pharmacokinetic Data, Macmillan Publishers Ltd, pp 25-85, 1992.
[28] Belsey, D.A.; Kuh, E.; Welsch, R.E., Regression Diagnostics. Wiley, New York, 1980.
[29] van de Waterbeemd, H. and Kansy, M., Hydrogen-bonding capacity permeability using calculated molecular descriptors. Quant. Struct.-Act Relat. 15:480-490, 1992.
[30] Krarup, H.; Christensen, T.I.; Hovgaard, L.; Frokjaer, S., Predicting drug absortion from molecular surface properties based on molecular dynamics simulations. Pharm Res. 15:972-978, 1998.
[31] Norinder, U.; Osterber, T.; Artursson, P., Theoretical calculation and prediction of caco-2 cell permeability using MolSurf parameterization and PLS statistics. Pharm Res. 14:1786-1791, 1997.
[32] Kulkarmi, A.; Han, Y.; Hopfinger, J., Predicting caco-2 cell permeation coefficients of organic molecules using membrane-interaction QSAR analysis. J Chem Inf Comput Sci, 42:331-342, 2002.
[33] Ren, S. and Lien, E.J. Caco-2 cell permeability vs human gastro-intestinal absorption: QSPR analysis. Prog Drug Res, 54:3-23, 2000.
[34] Conradi, R.A.; Buton, P.S.; Borcjhardt, R.T., In Pliska, V.; Testa, B.; van de Waterbeemd, H., (Eds.). Lipophilicity in Drug Action and Toxicology, VCH, Weinheim, 223-252, 1996.
[35] van de Waterbeemd, H.; Smith, D.A.; Jones, B.C., Lipophilicity in pK desing: Methyl, ethyl, futile. J Comput-Aided Mol Des, 15:273-286, 2001.
[36] Stenberg, P.; Luthman, K.; Artursson, P., Virtual screening of intestinal drug permeability. J Contr Rel, 65:231-243, 2000.
[37] Walters, W.P.; Stahl, M.T.; Murcko, M.A., Virtual screening-an overview. Drug Disc Today, 3:160-178, 1998.
[38] Drie, J.H.V. and Lajinees, M.S., Approaches to virtual library design. Drug Disc Today, 3:274-283, 1998.
[39] de Juli´an-Ortiz, J.V.; Gálvez, J.; Muñoz-Collado, C.; García- Domenech, R.; Gimeno-Cardona, C., Virtual combinatorial syntheses and computational screening of new potential anti-herpes compounds. J Med Chem, 42:3308-3314, 1999.
[40] Artursson, P., Epithelial transport of drugs in cell culture. I: A model for studying the passive diffusion of drugs over intestinal absorptive (Caco-2) cells. J Pharm Sci, 79:476-482, 1990.
[41] Haeberlin, B.; Rubas, W.; Nolen III, H.; Friend, D.R., In vitro evaluation of dexamethasone-b-D-glucuronide for colon-specific drug delivery. Pharm. Res, 10:1553-1562, 1993.
[42] Hovgaard, L.; Brøndsted, H.; Buur, A.; Bundgaard, H., Drug delivery studies in Caco-2 monolayers. Synthesis, hydrolysis, a transport of O-cyclopropane carboxylic acid ester produgs of various b-blocking agents. Pharm Res, 12:387-397, 1995.
[43] Augustijns, P.; D¢Hulst, A.; Daele, J.V.; Kinget, R., Transport of artemisinin and sodium artesnate in Caco-2 intestinal epithelial cell. J Pharm Sci. 85:577-579, 1996.
[44] Collett, A.; Sims, E.; Walker, D.; He, Y.L.; Ayrton, J.; Rowland, M.; Warhusrst, G. Comparison of HT29-18-C1 and Caco-2 cell lines as models for studying intestinal paracellular drug absorption. Pharm Res.13:216-221, 1996.
[45] Walter, E.; Janich, S.; Roessler, B.J.; Hilfinger, J.M.; Amidon, G.L., HT29-MTX/Caco-2 cocultures as an in vitro model for the intestinal epithelium: In vitro-in vivo correlation with permeability data from rats and humans. J Pharm Sci, 85:1070-1076, 1996.
[46] Artursson, P. and Magnusson, C., Epithelial transport of drugs in cells culture. II: Effect of extracellular calcium concentration on the paracellular transport of drugs of different lipophilicities across monolayers of intestinal epithelial (Caco-2) cells. J Pharm Sci. 79:595-600, 1990.
[47] Stenberg, P.; Norinder, U.; Luthman, K.; Artursson, P., Experimental and computational screening models for the prediction of intestinal drug absorption. J. Med. Chem. 44:1927-1937, 2001.
[48] Grès, M.; Julian, B.; Bourrié, M.; Meunier, V.; Roques, C.; Berger, M.; Boulenc, X.; Berger, Y.; Fabre, G., Correlation between oral drug absorption in humans and apparent drug permeability in TC-7 Cells, a human epithelial intestinal cell line: Comparison with the parental Caco-2 cell line. Pharm Res, 15:726-733, 1998.
[49] Stewar, B.H.; Chan, O.H.; Lu, R.H.; Reyner, E.L.; Schmid, H.L.; Hamilton, H.W.; Steinbaugh, B.A.; Taylor, M.D. Comparison of intestinal permeabilities determined in multiple in vitro and in situ models: Relationships to absorption in humans. Pharm Res. 12 :693-699, 1995.
[50] Hilgendorf, C.; Spahn-Langguth, H.; Regardh, C.G.; Lipka, E.; Amidon, G.L.; Langguth, P., Caco-2 versus Caco-2/HT29-MTX co-cultured cell lines: Permeability via diffusion, inside-and outside-directed carrier-mediated transport. J Pharm Sci, 89:63-75, 2000.
[51] Augustijns, P.; D¢Hulst, A.; Daele, J.V.; Kinget, R., Transport of artemisinin and sodium artesnate in Caco-2 intestinal epithelial cell. J Pharm Sci. 85:577-579, 1996.
[52] Amidon, G.L.; Sinko, P.J.; Fleisher, D., Estimating human oral fraction dose absorbed: a correlation using rat intestinal membrane permeability for passive and carrier-mediated compounds. Pharm Res. 5:651-654, 1988.
Corresponding Author: Yovani Marrero Ponce, Department of Pharmacy, Faculty of Chemical-Pharmacy, Central University of Las Villas, Santa Clara 54830, Villa Clara, Cuba. yovanimp@qf.uclv.edu.cu
Published by the Canadian Society for Pharmaceutical Sciences.
Copyright © 1998 by the Canadian Society for Pharmaceutical Sciences.
http://www.ualberta.ca/~csps
