J Pharm Pharmaceut Sci (www.ualberta.ca/~csps) 6(2):302-307, 2003
Measurement of nitric oxide in murine Hepatoma Hepa1c1c7 cells by reversed phase HPLC with fluorescence detection.
Negar Gharavi, Ayman O.S. El-Kadi1
Faculty of Pharmacy and Pharmaceutical Sciences, University of Alberta, Edmonton, Alberta, CanadaReceived 20 June 2003, Revised 8 August 2003, Accepted 11 August 2003
PDF version
Abstract
Purpose: Nitric oxide (NO) is produced by various cell types in picomolar to nanomolar range and has important roles in a variety of biological functions. The aim of the present study was to investigate a sensitive and reproducible fluorometric HPLC method for measuring nitrite, one of the stable oxidation products of nitric oxide, in murine hepatoma Hepa 1c1c7 cells. METHODS. Hepa 1c1c7 cells were incubated with vehicle or recombinant murine tumor necrosis factor- a (TNF- a, 10 ng/ml) in Hanks' balanced salt solution (HBSS) for 10 hours. Thereafter, the HBSS medium was collected for nitrite analysis. NO production was examined by measuring the conversion of 2, 3-diaminonaphthalene (DAN) to its fluorescent product, 2, 3-naphthotriazole (NAT). NAT was analyzed after elution with 60% of 15 mM sodium phosphate buffer (pH = 7.5) and 40% methanol through a 10-μm reversed-phase C18 column (250 x 4.00 mm, I.D.) at a flow rate of 1 ml /min. Fluorescence was monitored with excitation at 375 nm and emission at 415 nm. RESULTS. NAT appeared in approximately 16 min with no interference peaks. The assay yielded linear response within the examined range of 10 - 200 pM (r2 >0.99) with an intra and inter-day variability of <10 % and accuracy of > 90%. The detection limit for nitrite was 10 pM. NO production by TNF- a treated Hepa 1c1c7 cells is estimated to be approximately 2 folds more than untreated cells. CONCLUSION. This fluorometric HPLC assay offers a sensitive and reliable measurement of NO production in cell culture medium.
Introduction
Nitric oxide (NO), an unstable molecule, is biosynthesized from the amino acid L-arginine by at least three different isoforms of NO synthase (neuronal, nNOS; endothelial, eNOS; and inducible, iNOS) (1). Activation of different cell types such as macrophages, endothelial cells, fibroblasts and hepatocytes with pro-inflammatory cytokines results in the expression of a distinct isoform of NO synthase (iNOS) (2). The resulting NO free radical species, may quickly reacts with molecular oxygen and water to form a variety of end products, including nitrite (NO 2 ¯), nitrate (NO 3 ¯), and S-nitrosothiols (RSNO) (3, 4).
NO is produced by various cell types in picomolar to nanomolar range and has a very short half-life (t 1/2 <5s) in biological fluids; therefore, a direct measurement of its production is difficult and the analysis of NO 2 ¯ and NO 3 ¯, the stable products of NO oxidation, is often performed to estimate NO level in biological fluids and cell culture medium (3).
Several methods of measuring NO 2 ¯ such as Griess colorimetric assay (5), chemiluminescence analysis (6), gas chromatographic analysis (7), hemoglobin trapping (8) and fluorometric method (9) have been developed. However, the most commonly employed method for the analysis of NO 2 ¯ in aqueous solutions is the Griess colorimetric assay (8).
The Griess assay is a well-known two-step diazotization reaction in which NO 2 ¯ in the sample reacts with sulfanilic acid to produce the diazonium ion, which is then coupled to N-(naphthyl) ethylenediamine to form the chromophormic azo derivative (10). Although the Griess reaction is simple and fast, its detection limit for NO 2 ¯ is only 0.1 - 1 mM (8). The lack of sensitivity restricts the application of this colorimetric method for quantifying micromolar levels of NO 2 ¯and NO 3 ¯ in biological samples (11).
On the other hand, the chemiluminescence assay is considered the most useful method for highly sensitive real-time assay of unstable radicals such as NO at low concentrations in physiological solutions and its detection limit is approximately 100 fM (8). The chemiluminescence assay, however, requires an expensive and bulky apparatus, also there is an interference between NO and N-nitro-L-arginine (a commonly used inhibitor of NO synthesis) and some nitroso compounds such as S-nitrosothiols and nitrosodiphenylamine (6, 12).
The other two analysis procedures also have many disadvantages. Gas chromatographic analysis requires extensive sample preparation procedures and expensive analytical equipment that is not commonly available in many laboratories and it suffers poor reproducibility (13). Oxyhemoglobin (HbO2) oxidation method or hemoglobin trapping is based on the oxidation reaction of HbO2 to methemoglobin (MetHb) by NO (8). However, there are two problems with this method. First, it is difficult to reproducibly prepare a constant amount of HbO2 . The second problem is that HbO2 reacts with NO 2¯ to form MetHb. Therefore, it is intrinsically difficult to differentiate NO from its decomposed product (8).
Beside the above mentioned methods, a number of ion exchange (10, 14-22), reversed phase ion-paired (23, 24) and reversed phase (11, 25, 26) HPLC methods have been developed for measuring NO2- and NO3¯ in biological systems using UV-VIS absorbance (14, 16, 18, 23, 24), conductivity (15), electrochemical (19, 21) or fluorescence (11, 17, 25, 26). Most HPLC methods require several purification steps to remove interfering substances such as chloride (15, 20) and biogenic amines (16, 18, 25) and need prior filtration before injection of the samples to the HPLC system. These additional preparative steps may cause variable recovery and introduce contamination by environmental NO2¯ and NO3¯ (11). In addition, the HPLC methods with UV-VIS, conductimetric, electrochemical or some fluorescence detection suffer from low sensitivity (14, 15-17, 22-26) compared with the fluorometric method and chemiluminescence assays (6, 9, 12, 27).
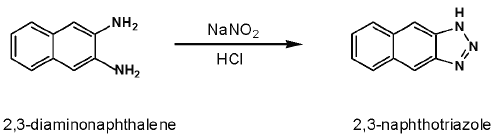
The batch fluorometric assay is based on the reaction of NO2¯ with 2, 3-diaminonaphthalene (DAN) as an indicator of NO formation, under acidic conditions to yield the fluorescent product 2, 3-naphthotriazole (NAT) (Figure 1) (28).
Figure 1: Reaction of nitrite with 2.3-diamoninaphthalene (DAN) to form 2, 3-naphthotriazole (NAT).
The minimum detectable amount of NO2¯ is 10 - 20 nM (9). However, there is difficulty in employing the batch fluorometric method to detect picomolar levels of NO2¯ and NO3¯ in cell culture medium and biological samples because of high background absorbance as well as the fluorescence quenching and interference by biological components and colorimetric chemicals (11).
A literature survey showed that most of the reports published on the measuring of NO in cell culture medium were carried out in isolated macrophages or macrophage cell lines that produce NO in micromolar range. The objective of this study was to develop a feasible and more sensitive method for measuring NO in murine hepatoma Hepa 1c1c7 cells. In this study, we showed for the first time that we could measure NO in Hepa 1c1c7 cells at picomolar levels. Thus, this method offers high sensitivity for determining picomolar levels of NO2¯ in cell culture medium. In addition, we compared our HPLC method with most commonly used method, Griess method, to measure NO2¯ in Hepa 1c1c7 cells.
Materials and Methods
Materials
HPLC-grade acetonitrile, methanol and water were purchased from Fisher Scientific (Edmonton, AB, Canada). DAN was obtained from ICN Biomedicals (Costamesa, California, USA). Cell culture materials: L-glutamine, gentamycin sulfate, penicillin, streptomycin, amphotericin B, and fetal bovine serum (FBS) were obtained from Invitrogen (Burlington, ON, Canada). Recombinant murine tumor necrosis factor- a (TNF- a) was purchased from Peprotech Canada (Ottawa, ON, Canada). All other chemicals, which were analytical grade, were obtained from Sigma-Aldrich (St. Louis, MI, USA).
Cell culture and treatments
Hepa 1c1c7 cell lines (generously provided by Dr. O. Hankinson, University of California, LA, USA) were maintained in standard media consisting of Dulbecco's modified eagle medium (DMEM) supplemented with 10% FBS, 20 m M L-glutamine, 50 m g/ml gentamycin sulfate, 100 IU/ml penicillin, 10 mg/ml streptomycin, and 25 ng/ml amphotericin B. Cells were grown in 75-cm2 tissue culture flasks at 37°C in a 5% CO2 humidified environment (29). Before culturing into 6-well sterile cell culture plates they were washed with phosphate buffer saline (PBS), trypsinized and re-suspended in DMEM containing 10% FBS. From this stock 2 ml was transferred into each well of the 6-well cell culture plate which was incubated for 24 hours in a humidified incubator in 5% CO2 at 37°C. The medium in the cell culture plate was then discarded, each well washed with PBS and 0.5 ml of Hanks' balanced salt solution, HBSS (1.26 mM CaCl2.2H2O, 5mM KCl, 0.4 mM KH2PO4, 0.8 mM MgSO4.7H2O, 137 mM NaCl, 4 mM NaHCO3, 0.3 mM Na2HPO4.7H2O, 5.5 mM glucose) was transferred into each of the 6-well cell culture plate. The plates were then incubated with vehicle or TNF- a (10 ng/ml) in the humidified incubator in 5% CO2 at 37°C for 10 hours. Thereafter, HBSS medium or cells were collected and stored at -20°C until analyzed for their NO2¯ and protein content, respectively. Cellular protein content was measured using Lowry method (30).
Griess assay
The amount of NO2¯ in the HBSS medium because of the stimulation of the Hepa 1c1c7 cells with TNF-a was determined by Griess method (31). Using 96-well cell culture plates, each well was filled with 100 ml of the HBSS medium mixed with an equal volume of Griess reagent. After 10 minutes at room temperature, the optical density of the samples was measured using Bio-Tek El-312e microplate reader (Winooski, VT, USA) at 560 nm.
HPLC analysis of nitrite
At room temperature, DAN reacts rapidly with NO2¯ under acidic conditions to form the highly fluorescent product NAT (12) (Figure 1), which is stable in alkaline solution (32). Fluorescence is monitored following the addition of NaOH, which raises pH and increases the sensitivity (12).
For preparing the samples, the HBSS medium was diluted 1:3 with acetonitrile, vortex-mixed for 30 seconds and then centrifuged at 12,000 g for 30 min to precipitate the protein. Thereafter, the supernatant was aspirated and the extra solvent was evaporated (Savant Speed Vac concentrator-evaporator, Emerson Instruments Scarborough, ON, Canada). The residue was reconstituted in 100 ml of double distilled water. HBSS medium was used because we found that DAN reacts with the DMEM contents and results in peaks that interfere with our NAT.
For HPLC analysis of NO2¯, 100 ml of NO2¯ standard (0-200 pM) or samples, dissolved in double-deionized water, were incubated in the dark at 25°C with 10 ml of freshly prepared DAN (1 mg/ml in 0.62 M HCL) for 10 min, followed by addition of 5 ml of 2.8M NaOH. This reaction mixture was directly used for the chromatographic analysis.
HPLC System
The system consisted of a Sil-9A model autosampler (Shimadzu, Japan), a Waters 470 model fluorescence detector set at 375nm as excitation and 415nm as emission (Waters, Mississauga, ON, Canada) and a 3390A model integrator (Hewlett Packard, USA). The mobile phase, 60% of 15 mM sodium phosphate buffer (pH = 7.5) and 40% methanol, was pumped through the system using a Waters 501 model HPLC pump (Waters, Mississauga, ON, Canada) at a flow rate of 1 ml/min. A 10- mm reversed-phase C18 column (250 x 4.00 mm, I.D.) and a HPLC guard-column insert packed with C18 were used for the assay. 30 ml of the derivatized nitrite - DAN solution was injected into the HPLC system at room temperature.
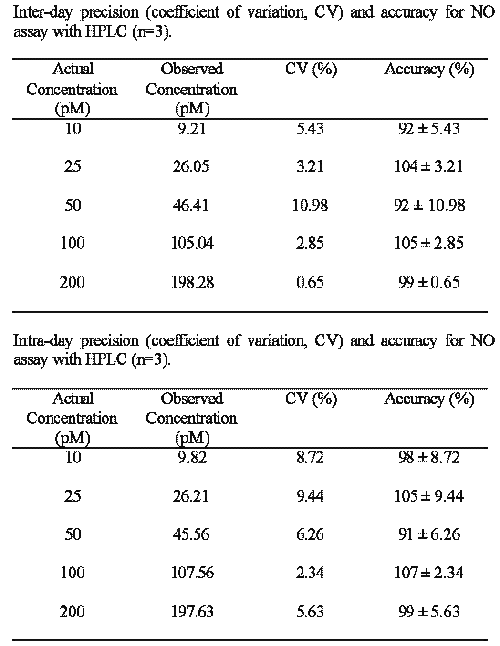
Accuracy and Precision
Each sample was prepared in triplicate on three consecutive days. The accuracy (the nearness of a measured value to the true value) was expressed as the mean percentage error, [(mean measured concentration)/ (expected concentration)] x 100. The precision (agreement between replicate measurements) was evaluated as inter and intra-day coefficient of variation by the relative deviation [%CV = (SD/mean) x 100]. Least-squared regression method was used to determine the regression coefficient and the equation for the best fitting line
Statistics
The comparison of the results from the experimental groups and its control was carried out by One-way analysis of Variance (ANOVA) followed by the Newman-keuls post hoc test.
Results
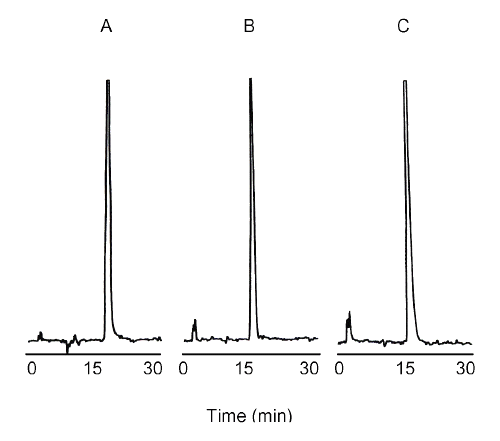
Typical chromatograph of NO2¯, obtained after direct injection of standard, untreated cells or cells treated with TNF-α are presented in Figure 2. NAT appeared on the chromatograph in approximately 16 min with no interference peaks. Under our experimental conditions, DAN did not interfere with NAT (Figure 2). The fluorescence intensity for NAT, at excitation at 375 nm and emission at 415 nm, is at least 90-100 folds higher than that observed for an equimolar concentration of DAN (9). It is important to mention that fluorescent substances present in the cell culture medium (DMEM) were eliminated in our method by using HBSS medium. Thus, our HPLC method offers greater specificity for determining NO2¯ in cell culture than all other fluorometric methods used previously.
Figure 2: Representative 30 min chromatograph of NAT: A) Standard, 200 pM nitrite, B) Untreated cells, 137 pM nitrite, C) TNF- a -treated cells, 279 pM nitrite.
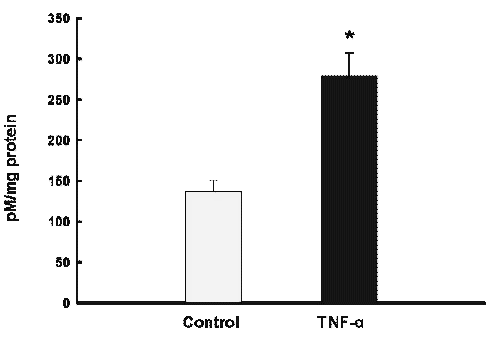
In this HPLC method, excellent linearity was observed between the peak area and NO2¯ concentration over the range of 10 to 200 pM (r2 >0.99). The detection limit for NO2¯ was 10 pM, based on a signal to noise ratio of three, when using the Waters 470 Fluorescence Detector at a gain setting of 1000. Inter and Intra-day reproducibility were determined using different concentrations of standard NO2¯ (10, 25, 50, 100 and 200 pM). These concentrations were assayed in triplicate on three consecutive days. Inter and intra-day reproducibility characterized by CV did not exceed 11% and 10% respectively. In addition, the accuracy of the assay was above 90% (Table 1). Incubation of Hepa 1c1c7 cells for 10 hours in the presence of TNF-α (10 ng/ml), conditions which lead to a marked expression of iNOS and NO formation, resulted in the formation of NO2¯ in picomolar range as determined by our fluorescence HPLC analysis (Figure 3), thereby improving the specificity and sensitivity of the HPLC method for analysis of NO2¯ in cell culture medium. These data indicate the high reproducibility and reliability of the method for determining NO2¯. NO production by TNF- α treated cells is estimated to be approximately two folds higher than that of untreated cells (p<0.05) (Figure 3). Using the Griess colorimetric assay, we failed to detect NO2¯ in Hepa1c1c7 wild-type cells.
Figure 3: Determination of nitrite in Hepa 1c1c7 cells with fluorometric HPLC method. Cells were treated with TNF- a (10 ng/ml) in HBSS for 10 hrs prior to assay. Data are expressed as mean ± SD (n = 6), *p<0.05 compared to control.
Table 1: Assay Validation Data.
Discussion
The formation of NO can result in several reactive nitrogen intermediate that can be determined by various detection methods (15). Although many recent publications substantiate this interest, there is no work to our knowledge that measures picomolar levels of NO2¯ in Hepa 1c1c7, one of the most common cell types used in drug metabolism studies. Therefore, the goal of present study was to developed simple method to measure NO2¯ in this cell lines.
The low detection limit of Griess reagent and other common methods for measuring NO2¯ in cell culture system has hampered attempts to study the precise metabolic pathways of NO during cellular damage. Several attempts have recently been made to measure NO2¯ levels in the nanomolar range using expensive or difficult techniques. However, while these techniques require expensive equipment, HPLC systems are available in most laboratories. HPLC is a convenient and rapid technique for the separation of a wide variety of chemical species, including biological molecules, and can be employed for the determination of NO2¯.
In the present study, we demonstrated that the activation of Hepa 1c1c7 cells with TNF- a results in a marked increase in NO formation. In contrast to the Griess method, this HPLC method can be used to measure NO2¯ production in picomolar range.
The sensitivity of this HPLC method for NO2¯ analysis is greater than that of the batch fluorometric method (detection limit, 10-20 mM), the Griess colorimetric assay (detection limit 0.1 - 1 mM) (8, 9), and the HPLC methods with UV-VIS or conductimetric detection (detection limit, 0.1-0.5 mM) (14, 28). Moreover, we found that the samples were prepared by our method could be used directly for NO2¯ analysis by the HPLC method without prior filtration. With this method, we are also able to eliminate the high background absorbance caused by the contents of DMEM cell culture medium.
In conclusion, the fluorometric HPLC method described here offers a high sensitivity, reproducibility and specificity for measuring picomolar levels of NO2¯. Moreover, the simple sample preparation with this method makes it particularly suitable for routine analysis of a large series of samples. The measurement of NO synthase activity in biological systems has attained increasing importance, as the enzyme's involvement in both normal and pathological process is elucidated (1-4).
ACKNOWLEDGMENTS
The authors are grateful to Dr. F. Jamali (University of Alberta) for his helpful comments and assistance. This work was supported by a grant from the Natural Sciences and Engineering Research Council of Canada (NSERC) RGPIN#250139-02.
References
Southan, G.J., and Szabo, C., Selective pharmacological inhibition of distinct nitric oxide synthase. Biochem. Pharmacol., 51:383-394, 1996.
Xie, Q.W., Cho, H.J., Calaycay, J., Mumford, R.A., Swiderek, K.M., Lee, T.D., Ding, A., Troso, T., and Nathan, C. Cloning and characterization of inducible nitric oxide synthase from mouse macrophages. Science, 256: 225-8, 1992.
Moncada, S., Palmer, R. M., and Higgs, E. A., Nitric oxide: physiology, pathophysiology, and pharmacology. Pharm. Rev., 43: 109 142, 1991.
Nathan, C., Nitric oxide as a secretory product of mammalian cells. FASEB J., 6: 3051-3064, 1992.
Egami, F.; Taniguch, S.; and Bergmeyer, H. U., Methods of Enzymatic Analysis, Academic Pree, New York, USA, p.2260, 1974.
Cox, R.D., Determination of nitrate and nitrite at the parts per billion levels by chemiluminescence. Anal. Chem., 52:332, 1980.
Johnson, A.A., and Burleson, D.G., Nitrate analysis in biological fluids by gas chromatography-nitrogen-phosphorous detection. Anal. Biochem., 236: 331-337, 1996.
Nagano, T., Practical methods for detection of nitric oxide. Luminescence, 14:283-290, 1999.
Misko, T.P., Schilling, R.J., Salvemini, D., Moore, W.M., and Currie, M.G., A fluorometric assay for the measurement of nitrite in biological samples. Anal. Biochem., 214: 11-16, 1993.
Miles, A. M., Wink, D. A., Cook, J. C., and Grisham, M. B., Determination of nitric oxide using fluorescence spectroscopy. Methods in Enzymol., 268: 105-20, 1996.
Li, H., Meininger, C.J., and Wu, G., Rapid determination of nitrite by reversed-phase high-performance liquid chromatography with fluorescence detection. J. Chromatogr. B., 746:199-207, 2000.
Hampl, V.; Walter, C. L.; Archer, S. L.; Fellisch, M.; and Stamler, J. S., Methods in Nitric Oxide Research, Wiley, New York, USA, p.309, 1996.
Bedwell, D.W., Rivera, V. R., Merrill, G. A., and Pusateri, A. E., Elimination of matrix-based interferences to a fluorescent nitrite/nitrate assay by a simple filtration procedure. Anal. Biochem., 284: 1-5, 2000.
Marzinzig, M., Nussler, A.K., Stadler, J., Marzinzig, E., Barthlen, W., Nussler, N.C., Beger, H.G., Morris, S.M., Bruckner, Jr.S., and Bruckner, U.B. Improved methods to measure end products of nitric oxide in biological fluids: nitrite, nitrate, and S-nitrosothiols. Nitric Oxide: Biol. Chem., 1:177-189, 1997.
Stratford, M. R. L., Dennis, M. F., Cochrane, R., Parkins, C. S., and Everett, S. A. The role of nitric oxide in cancer. Improved methods for measurement of nitrite and nitrate by high-performance ion chromatography. J. Chromatogr. A., 770:151-155, 1997.
Menyawi, EI, Looareesuwan, S., Knapp, S., Thaihammer, K. F., Stoiser, B., and Burgmann, H., Measurement of serum nitrite/nitrate concentrations using high-performance liquid chromatography. J. Chromatogr. B., 706: 347-351, 1998.
Meyer, J., Richter, N., and Hecker, M., High-performance liquid chromatographic determination of nitric oxide synthase-related arginine derivatives in vitro and in vivo. Anal. Biochem., 247: 11-16, 1997.
Smith, C.C., Stanyer, L., and Betteridge, D.J., Evaluation of methods for the extraction of nitrite and nitrate in biological fluids employing high-performance anion-exchange liquid chromatography for their determination. J. Chromatogr. B. Analyt. Technol. Biomed. Life. Sci., 779:201-9, 2002
Jedlickova, V., Paluch, Z., Alusik, S., Determination of nitrate and nitrite by high-performance liquid chromatography in human plasma. J. Chromatogr. B. Analyt. Technol. Biomed. Life Sci., 780: 193-7, 2002.
Everett, S.A., Dennis, M.F., Tozer, G.M., Prise, V.E., Wardman, P., and Stratford, M.R., Nitric oxide in biological fluids: analysis of nitrite and nitrate by high-performance ion chromatography. J. Chromatogr. A., 706:437-42, 1995.
Preik-Steinhoff, H., and Kelm, M., Determination of nitrite in human blood by combination of a specific sample preparation with high-performance anion-exchange chromatography and electrochemical detection. J. Chromatogr. B. Biomed. Apples., 685:348-52, 1996.
Nussler, A.K., Bruckner, U.B., Vogt, J., and Radermacher, P., Measuring end products of nitric oxide invivo. Methods Enzymol., 359: 75-83, 2002.
Michigami, Y., Yamamoto, Y., and Ueda, K., Determination of nitrite, sulphate, bromide and nitrate in human serum by ion chromatography. Analyst., 114: 1201-1205, 1989.
Stein, C., Classen, H. G., and Schmedt, C. G., Kinetic studies on nitrite and nitrate in rats by ion-pair chromatography. Clin. Chim. Acta., 175: 167, 1998.
Kumarathasan, P., Goegan, P., and Vincent, R., An automated high-performance liquid chromatography fluorescence method for the analyses of endothelins in plasma samples. Anal. Chem., 299:37-44, 2001.
Woitzik, J., Abromeit, N., and Schaefer, F., Measurement of nitric oxide metabolites in brain microdialysates by a sensitive fluorometric high-performance liquid chromatography assay. Anal. Biochem., 289:10-17, 2001.
Zafiriou, O. C., and McFarland, M., Determination of trace levels of nitric oxide in aqueous solution. Anal. Chem., 52: 1662-1667, 1980.
Wiersma, J.H., 2, 3-Diaminonaphthalene as a Spectrophotometric and Fluorometric Reagent for the Determination of Nitrite Ion. Anal. Lett., 3:123, 1970.
Sinal, C. J., and Bend, J. R., Aryl hydrocarbon receptor-dependent induction of cyp1a1 by bilirubin in mouse hepatoma hepa 1c1c7 cells. Molecular Pharmacol., 52: 590-599, 1997.
Lowry, O.H., Rosebrough, N.J., Farr, A.L., and Randall, R.J., Protein measurement with the folin phenol reagent. J. Bio. Chem., 193: 265-275, 1951.
Schmidt, H.H., Determination of Nitric Oxide via measurement of nitrite and nitrate in culture media. Biochemica., 22, 1995.
Sawicki, C. R., Fluorometric Determination of Nitrate. Anal. Lett., 4:761-775, 1971.
Corresponding Author: Ayman O.S. El-Kadi, Faculty of Pharmacy, University of Alberta, Edmonton, Alberta, Canada T6G 2N8 aelkadi@pharmacy.ualberta.ca
Published by the Canadian Society for Pharmaceutical Sciences.
Copyright © 1998 by the Canadian Society for Pharmaceutical Sciences.
http://www.ualberta.ca/~csps