J Pharm Pharmaceut Sci (www.ualberta.ca/~csps) 5(2):169-175, 2002
Reanalysis of carbamazepine and carbamazepine-epoxide pharmacokinetics after multiple dosing of extended release formulation
Julraht Konsil1
Department of Clinical Pharmacy, Faculty of Pharmaceutical Sciences, Khon Kaen University, Khon Kaen, ThailandSomchit Dechasathian,
KhonKaen Provincial Health Office, Khon Kaen, ThailandDavid H. Mason, Jr.
Athena Neurosciences, Inc., South San Francisco, California, USARuth E. Stevens
Duramed Pharmaceuticals, Inc., Cincinnati, Ohio, USAReceived July 11th, 2001, Revised May 9th, 2002, Accepted May 14th, 2002
PDF version
Abstract
PURPOSE. To model and re-evaluate the pharmacokinetics of carbamazepine (CBZ) and CBZ-10, 11-epoxide (CBZ-E) after 5 day b.i.d. dosing with either Carbatrol® (extended-release beads) or Tegretol-XR® (an osmotic pump tablet, an Oros® tablet) using compartmental method.
METHODS Plasma concentration time profile data from 15 normal healthy adults received, in a randomized crossover fashion, Carbatrol® (2 x 200 mg capsules), b.i.d. for 5 days and Tegretol-XR® (400 mg), b.i.d. for 5 days were available for analysis from previous study. The compartmental kinetic parameters of CBZ and CBZ-E were simultaneously fitted by assuming: i) one compartment open model with zero order absorption with lag time, and first order elimination for CBZ and ii) one compartment open model with Michaelis-Menten formation with a sigmoidity factor, and first order elimination for CBZ-E. Time to 50% of CBZ plateau concentrations (TC50) was estimated and statistically compared between the two products.
RESULTS . There was a good agreement between simulated and observed plasma concentrations. For CBZ, the fitted parameters were: the first order elimination rate constant (K10) 0.024 and 0.022 hr-1, t1/2 27.3 and 30.3 hr, volume of central compartment (V1 ) 1.119 and 1.160 L/kg, for Carbatrol® and Tegretol-XR®, respectively. For CBZ-E, the fitted parameters were: the first order elimination rate constant (K 30 ) 0.128 and 0.157 hr -1 , t 1/2 6.1 and 5.1 hr, volume of central compartment (V 3 ) 0.728 and 0.644 L/kg, V max 0.085 and 0.076 mg/hr/kg, K m 28.639 and 33.138 mg/mL, for Carbatrol® and Tegretol-XR® , respectively. The fitted pharmacokinetic parameters of CBZ and CBZ-E were generally consistent with published values from previous studies. A minimal rise in CBZ-E concentrations was observed during the first 12 hours, the finding of which has not been reported before. Consequently, the CBZ-E plasma profiles appear as sigmoid curves and have a different shape compared to those of the CBZ profiles. The inclusion of the sigmoidity factor allowed flexibility in the fitting and optimized the simulation results. When compared to published literature of single dose data, the investigation of CBZ and CBZ-E pharmacokinetics from this study suggested that autoinduction might occur by the fifth day of dosing and might partly contribute to the sigmoidal shape of CBZ-E profiles.
CONCLUSION . The fitted model well described the plasma profiles of both CBZ and CBZ-E. Carbatrol® and Tegretol-XR® were similar in their pharmacokinetics based on compartmental analysis.
Introduction
Carbamazepine (CBZ) was approved in the U.S. for use as an antiseizure agent and indicated for the treatment of trigeminal neuralgia. It is now considered the primary drug for the treatment of partial and tonic-clonic seizures (1). 33 metabolites of CBZ have been described (2). The cytochrome P450-mediated formation of CBZ-10, 11-epoxide (CBZ-E, Figure 1) is the prominent pathway of CBZ metabolism (3).
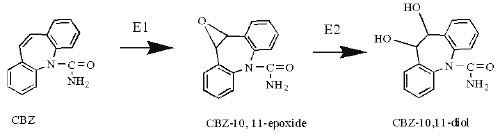
Figure 1: The epoxide-diol pathway of CBZ metabolism. E1-monooxygenase, E2-epoxide hydrolase.
The intermediate metabolite CBZ-E is almost entirely converted to CBZ-10, 11-diol, which is then excreted into urine in a free or conjugated form (4). Autoinduction in humans is believed to involve the 10, 11-oxidation pathway only (5-6). Plasma concentrations of CBZ-E are usually 10-50% those of the parent drug during therapy (7). In animal experiments, CBZ-E has anticonvulsant activity comparable with that of the parent compound (8-9).
Due to side effects related to fluctuation in CBZ plasma profiles (10-11), delivery of CBZ in controlled release fashion could decrease the problems (12-16). Carbatrol® and Tegretol-XR® , the two new extended release formulations, were developed and recently evaluated in humans (17). CBZ and CBZ-E pharmacokinetics of the two formulations were investigated and compared using noncompartmental analysis. It is worthy to further develop pharmacokinetic model to study the fate of CBZ and CBZ-E following the multiple dosing of the two controlled release formulations.
A linear pharmacokinetic model of one compartment with first order absorption was previously used by several investigators to describe CBZ and CBZ-E plasma data (18-20). Simultaneous fitting technique was said to be better for the estimation of CBZ-E kinetic parameters (18). However, in rat liver, the formation kinetics of CBZ-E followed Michaelis-Menten kinetics (21). Sumi et al. applied deconvolution technique and Lineweaver-Burk plot to estimate Vmax and Km values of CBZ epoxidation process in humans. They employed a two compartment open model with Michaelis-Menten kinetics for CBZ-E formation process and yielded a good simulation result (22). In the present study, a pharmacokinetic model describing CBZ and CBZ-E plasma profiles following the multiple dosing of Carbatrol® and Tegretol-XR® were developed using simultaneous fitting technique in ADAPT II, Release 4.0 (23). A one-compartment model with zero order input, first order elimination and Michaelis-Menten kinetics were selected to describe the fate of plasma CBZ and CBZ-E. The work was undertaken using data obtained previously (17).
Methods
Experiment
The details of study design, blood sample analysis and noncompartmental pharmacokinetic evaluation was described previously (17). Briefly, this was an open label, comparative randomized, two-way crossover bioavailability study. 5 females and 10 males (19 to 40 years old) were enrolled in the study. Under fasting conditions, each individual received either Carbatrol® (2x200 mg, Shire Laboratories Inc.) or Tegretol-XR® (400 mg, Ciba Geigy) b.i.d. for 5 days in a randomized crossover fashion with a minimum of a 9-day washout period. Blood was obtained before the initial dosing on Day 1, before the first dose on Days 2 to 5, and at the following times after dosing on Day 5: 1, 2, 3, 4, 5, 6, 7, 8, 9, 10, 11 and 12 hours post-dose.
Compartmental analysis
A model diagram to describe plasma concentration-time profiles of CBZ and CBZ-E is illustrated in Figure 2.
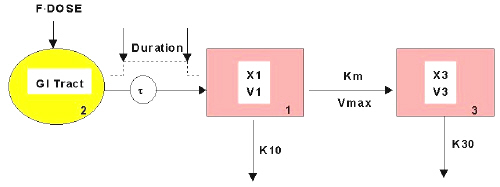
Figure 2: Model diagram to describe plasma concentration-time profiles of CBZ and CBZ-E.
Model Equations
Equation 1
Equation 2
Equation 3
Equation 4
Equation 5
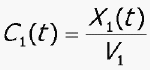
C 1 = concentration of CBZ in compartment 1
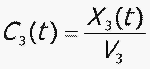
C 3 = concentration of CBZ-E in compartment 3
X 1 = amount of CBZ in compartment 1
X 3 = amount of CBZ-E in compartment 3
V 1 = volume of central compartment for CBZ
V 3 = volume of central compartment for CBZ-E
K 10 = the first order elimination rate constant of CBZ
K 30 = the first order elimination rate constant of CBZ-E
K m = Michaelis-Menten constant
V max = maximum metabolic rate
t = the CBZ absorption lag time
Estimation of time to 50% of plateau concentrations (TC 50 )
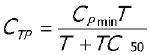
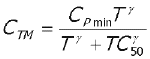
The overall appearance of observed CBZ and CBZ-E plasma concentration-time profiles following the two formulations were further investigated using Equations 6 and 7, respectively to investigate the speed to reach the plateau (30, 31). A sigmoidity factor g was added to the model of CBZ-E to optimize the fit (Equation 7).
Equation 6
Equation 6
Where
C TP = observed plasma CBZ concentrations at time "T"
C TM = observed plasma CBZ-E concentrations at time "T"
C Pmin = estimated minimum plasma concentrations at plateau
TC 50 = time to 50% of plasma concentration at plateau
g = a sigmoidity factor
RESULTS
Compartmental analysis
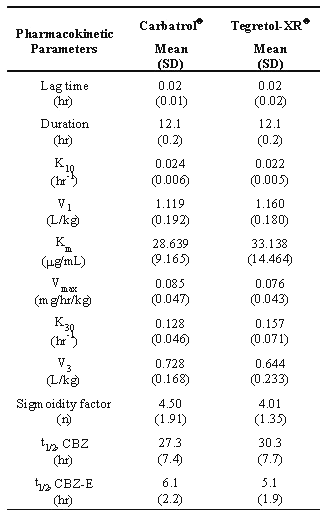
Table 1 presents the mean and standard deviation (n=15) of CBZ and CBZ-E fitted pharmacokinetic parameters following administration of Carbatrol® and Tergretol-XR®.
Table 1: Pharmacokinetic parameters of CBZ and CBZ-E (mean (SD), n=15) following administration of Carbatrol® and Tegretol-XR® obtained by simultaneous curve-fitting (ADAPT II, Release 4.0) of pharmacokinetic model in Figure 2.
The published pharmacokinetic parameters (22) were used as the initial values in the simulation process. The half-lives (without the input rate or formation rate limitation) of CBZ and CBZ-E were estimated from Ln2/(V max /K m /V 1 + K 10 ) and Ln2/K 30 , respectively. Graphs displaying the compartmental analysis are presented in Figure 3 (A, B, C, D, E and F).
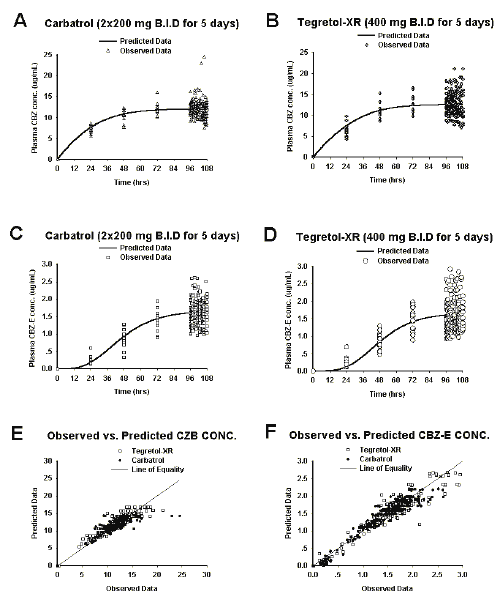
Figure 3: Compartmental analysis. Prediction in A, B, C and D were obtained using pooled data. The plots in E and F were resultant from each individual data fitting (n=15)
The predicted plasma profiles presented in Figures 3A, 3B, 3C, and 3D were simulated using pooled data, i.e. fitting to the mean plasma profiles of each formulation. The initial values of pharmacokinetic parameters used in the later modeling process were the average of individual pharmacokinetic parameters (n=15, Table 1). Both individual parent and metabolite data were well described by the proposed model as seen in Figures 3E and 3F.
Estimation of time to 50% of plateau concentrations (TC 50 )
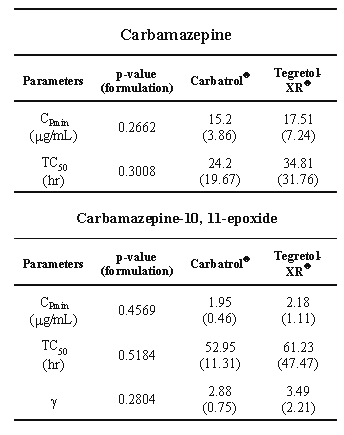
Table 2 displays the fitted values and their statistical analysis of CBZ and CBZ-E plasma profiles. There were no significant differences in estimated values of CPmin, TC50 or g after dosing of the two formulations. Carbatrol® and Tergretol-XR® given at this dosing regimen produced similar plasma profiles of CBZ and CBZ-E. TC50 of CBZ-E was approximately twice that of CBZ.
Table 2: Fitted values (Mean(SD), n=15) and their statistical analysis of CBZ and CB Z-E plasma profiles .
DISCUSSION
The fitted values of CBZ and CBZ-E half-life and volume of distribution obtained in this study concur with the literature values. Following are the previously reported pharmacokinetic parameters; 1) for CBZ: half-life 12 to 27 hr after multiple dose (5, 24-25) and volume of distribution 0.59 to 2.0 L/kg (2, 7), 2) for CBZ-E: half-life 4.0 to10.3 hr (4, 19, 26) and volume of distribution 0.59 to1.18 L/kg following a single dose administration (7, 19). In addition, the value of CBZ-E clearance, estimated from CL = K30 V3 using kinetic parameters in Table 1, were 0.093 and 0.101 L/h/kg for Carbatrol® and Tergretol-XR®, respectively. The values are similar to those of published values (plasma clearance ranged from 0.064 to 0.136 L/hr/kg (4)).
Simultaneous fitting using the model in Figure 2 well explained CBZ and CZB-E plasma profiles. Though V max and K m values obtained from the proposed model were not in a good agreement with those of the reported values following a single dose administration of CBZ immediate release formulations (22). Herein V max and K m values ranged from 0.002 to 0.156 mg/hr/kg and 12.86 to 63.78 mg/mL, respectively. V max and K m values derived in this study seemed to be smaller and larger, respectively, compared to the fitted values by Sumi et al. (0.176 mg/hr/kg for V max and 15.691 m g/mL for K m (22)). The difference between these values could be due to differences in type of the formulations, kinetic model, studied subjects, sampling points, and dose regimen.
Pharmacokinetic parameters derived from this proposed model also suggested a new evidence of possible autoinduction of CBZ. The fitted values of V max and K m could represent the average values before and during autoinduction and were likely to change with time. Eichelbaum et al. reported that the CBZ-E plasma concentration curves followed multiple dosing of CBZ (5). Following 2 consecutive CBZ 600 mg doses with 5 days apart, CBZ-E plasma concentration peaked after that of CBZ but declined in parallel with the plasma parent concentration in the semi-logarithmic plot (27). Herein, the shape of CBZ-E plasma profile differed from that of CBZ and appeared to be sigmoidal. The sigmoidal shape of CBZ-E profile has not been reported before. It was likely that the sigmoidal CBZ-E plasma profile occurred as a result of time-dependent change in pharmacokinetics (autoinduction of CBZ epoxidation). Increase in clearance was previously reported after the second dose of CBZ during the maintenance therapy (28) and multiple doses (27). The increase in CBZ-E formation rate with time during the multiple dosing of these extended release formulations could result in the sigmoid shape of CBZ-E plasma profile, i.e. the rate was slow at first but faster with time. Therefore, the sigmoidity factor (n and g) in Equations 3 and 7 would reflect the rapidity of change in the CBZ-E formation rate. The large number of the sigmoidity factor, the faster change in the rate over time. The fitted values of the sigmoidity factor indicated a quite rapid change in the rate over the five dosing days (Tables 1 and 2, n and g ranged from 2.9 to 4.5).
Comparison of the AUC 0-t ratios (CBZ-E to CBZ) and the CL ss values on Day 5 with previous report seems to further support the possibility of autoinduction. The mean AUC0-t ratios and CLss (estimated from DOSE/AUC 0-t were: i) 0.136 and 0.039 L/hr/kg for Carbatrol® ii) 0.131 and 0.038 L/hr/kg for Carbatrol® and Tergretol-XR®, respectively. The ratios were comparable to that of 21-day multiple dosing of chewable Tegretol® (0.130 - induced CBZ clearance) and were about twice that of the single dose (0.0645 -- noninduced CBZ clearance) (29). In addition, the estimated values of CLss were higher than those of the CBZ total body clearance following a single dose administration (about 0.02 L/h/kg (2, 7, 10)). As suggested by Bertilsson et al., autoinduction was apparent during the first doses and seemed to be complete during the first three to five weeks of maintenance therapy (7). The autoinduction occurring herein seemed to be only at the beginning of the process. However, it disappeared during the 9-day washout period since there was no significant difference in pharmacokinetics of CBZ and CZB-E following administration of the two formulations.
The purpose of plasma profile analysis using Equation 6 and 7 was to further investigate the overall difference in the appearance of CBZ and CBZ-E plasma profiles following administration of the two formulations. TC50 represented time to 50% of plasma concentration at plateau. The sigmoidity factor (g) provides a further degree of flexibility accounting for the curve (31). The larger the value of the exponent, the more curvature (steeper) is the CZB-E plasma profile (See Equation 7). When the two plasma profiles have the same g and CPmin , TC50 would reflect the speed to reach the plateau. The fast increase in CBZ plasma concentration is clinically important. Intolerable CBZ side effects could occur even at very low serum levels (<4 m g/mL), especially if initial dosing increased too rapidly (2, 10, 32). The non-significant difference in the values of CPmin, TC50 and g between the two formulations supported the general similarity in clinical performance of the two formulations.
ACKNOWLEDGEMENTS
The authors acknowledge the contributions of Gary D. Novack, Ph.D., Tharin Limsakun, Ph.D., Ms Gwyneth Evans and Ms Elizabeth Laker. This research was sponsored by Athena Neurosciences, Inc. The clinical study was conducted, on the contract, by Phoenix International Life Sciences, Inc. (Cincinnati, USA).
References
- McNamara, JO., Drugs Effective in the Therapy of the Epilepsies, in Hardman, JG, Limbird, LE., Molinoff, PB., Ruddon, RW., Gilman, AG. (eds) Goodman & Gilman's The Pharmacological Basis of Therapeutics, 9th ed., McGraw-Hill, INC, New York, NY, pp 473-475, 1996.
- Levy, RH., Wilensky, AJ., Anderson, GD., Carbamazepine, Valproic Acid, Phenobarbital, and Ethosuximide. In Evans, WE., Schentag, JJ., Jusko, WJ. (Eds), Applied Pharmacokinetics: Principles of Therapeutic Drug Monitoring, 3rd ed. Applied Therapeutics, Spokane WA, pp 26-1 to 26-29, 1992.
- Kudriakova TB., Sirota LA., Rozova GI., Gorkov VA., Autoinduction and steady-state pharmacokinetics of carbamazepine and its major metabolites. Br J Clin Pharmacol, 33:611-615, 1992.
- Tomson T., Tybring G., Bertilsson L., Single-dose kinetics and metabolism of carbamazepine-10,11-epoxide. Clin Pharmacol Ther, 33:58-65,1983.
- Eichelbaum, M., Ekbom, K., Bertilsson, L., Ringberger, VA. and Rane, A., Plasma kinetics of carbamazepine and its epoxide metabolites in man after single and multiple doses. Eur J Clin Pharmacol, 8:337-341, 1975.
- Faigle, JW., Feldmann, KF., Carbamazepine biotransformation, in Levy, R., Mattson, R., Meldrum, B., Penry, JK., Dreifuss, FE. (eds) Antiepileptic drugs, 3rd ed., Raven Press, New York, NY, pp 491-504,1989.
- Bertilsson, L., Tomson, T. Clinical pharmacokinetics and pharmacological effects of carbamazepine and carbamazepine-10,11-epoxide. An update. Clin Pharmacokinet, 11:177-198, 1986.
- Albright, PS., Bruni, J. Effects of carbamazepine and its epoxide metabolite on amygdala-kindled seizures in rats. Neurology, 34:1383-1386, 1984.
- Bourgeois, BFD., Wad, N. Individual and combined antiepileptic and neurotoxic activity of carbamazepine and carbamazepine-10, 11-epoxide in mice. J Pharmacol Exp Ther 231:411-415, 1984.
- Hoppener, RJ., Kvyer, A., Meijer, JWA., Hulsman, J. Correlation between daily fluctuation of carbamazepine serum levels and intermittent side-effects. Epilepsia, 21:341-350, 1980.
- Riva, R., Albani, F., Ambrosetto, G., Contin, M., Cortelli, P., Perucca, E., Baruzzi, A. Diurnal fluctuations in free and total steady-state plasma levels of carbamazepine and correlation with intermittent side effects. Epilepsia, 25:4776-4781, 1984.
- Fichsel, H. and Fuchs, V. Twenty-four hour serum concentration profiles in epileptic children of a new carbamazepine retard preparation. Epilepsia, 29:342, 1988.
- Aldenkamp, AP., Alpherts, WCJ., Moerland, MC., Otter-vanger, N., Van Parys, JAP. Controlled-release carbamazepine: cognitive side-effects in patients with epilepsy. Epilepsia, 28:507-514, 1987.
- Remy, C. Comparative open trial of carbamazepine and slow-release carbamazepine in epilepsy in adults. Presse Med, Mar 24;19(11):511-513,1990.
- Dhalla, Z., Bruni, J., Sutton, J. A comparison of efficacy and tolerability of controlled release carbamazepine with conventional carbamazepine. Can J Neural Sci, 18: 66-68, 1991.
- McKee, PJW., Blacklaw, J., Butler, E., Gilham, RA., Brodie, MJ. Monotherapy with conventional and controlled-release carbamazepine: a double-blind, double-dummy comparison in epileptic patients. Br J Clin Pharmacol, 32: 99-104, 1991.
- Stevens, RE,, Limsakun, T., Evans, G., Mason, JH.3rd. Controlled, Multidose, Pharmacokinetic Evaluation of Two Extended-Release Carbamazepine Formulation (Carbatrol and Tegretol-XR). J Pharm Sci, 87:1531-1534, 1998.
- Hooper, WD., King, AR., Patterson, M., Dickinson, RG., Eadie, MJ. Simultaneous plasma carbamazepine and carbamazepine-epoxide concentrations in pharmacokinetic and bioavailability studies. Ther Drug Monit, 7(1):36-40, 1985.
- Spina, E., Tomson, T., Svensson, JO., Faigle, JW., Bertilsson, L. Single-dose kinetics of enteric-coated formulation of carbamazepine-10, 11-epoxide, an active metabolite of carbamazepine. Ther Drug Monit, 10: 382-385, 1988.
- Bonneton, J., Iliadis, A., Genton, P., Dravet, C., Viallat, D., Mesdjian, E. Steady state pharmacokinetics of conventional versus controlled-release carbamazepine in patients with epilepsy. Epilepsy Research, 14:257-263, 1993.
- Chang, SL. and Levy, RH. Inhibition of epoxidation of carbamazepine by valproic acid in the isolated perfused rat liver. J Pharmacokinet Biopharm 13:453-466, 1985.
- Sumi, M., Watari, N., Umezawa, O., Kaneniwa, N. Pharmacokinetic Study of Carbamazepine and Its Epoxide Metabolite in Humans. J Pharmacobio-Dyn, 10:652-661, 1987.
- ADAPT II release 4.0 "Copyright 1997 Biomedical Simulations Resource, University of Southern California, California, USA.
- Hvidberg, EF. and Dam, M. Clinical pharmacokinetics of anticonvulsants. Clin Pharmacokinet 1: 161-188, 1976.
- Martin ES 3d, Crismon ML, Godley PJ Postinduction carbamazepine clearance in an adult psychiatric population. Pharmacotherapy 11: 296-302,1991.
- Hooper, WD., King, AR., Patterson, M., Dickinson, RG., Eadie, MJ. Simultaneous plasma carbamazepine-epoxide concentrations in pharmacokinetic and bioavailability studies. Ther Drug Monit, 7:36-40, 1985.
- Bernus, I., Dickinson, RG., Hooper, WD., Eadie, MJ. Early stage autoinduction of carbamazepine metabolism in humans. Eur J Clin Pharmacol 47: 355-360, 1994.
- Bertilsson, L., Hojer, B., Tybring, G., Osterloh, J., Rane, A. Autoinduction of carbamazepine metabolism in children examined by a stable isotope technique. Clin Pharmacol Ther, Jan;27(1):83-88,1980.
- Riad, LE., Chan, KK., Sawchuk, RJ. Transient steady-state analysis: application in the determination of the relative formation and elimination clearances of two major carbamazepine metabolites in humans. Pharm Res, 10:1090-1092, 1993.
- [30] Keen, RE., Spain JD. Computer Simulation in Biology: A Basic Introduction. Wiley-Liss, Inc., New York, USA, pp55, 1993.
- Gabrielsson, J., Weiner, D. Pharmacodynamic Concept, in Gabrielsson J: Weiner D (eds) Pharmacokinetic and Pharmacodynamic Data Analysis: Concepts and Applications, 2nd ed. Swedish Pharmaceutical Society, Swedish Pharmaceutical Press, Stockholm, Sweden, pp64, 186, 1997.
- Tomson, T. Interdosage fluctuations in plasma carbamazepine concentration determine intermittent side effects. Arch Neurol, 41:830-843, 1984.
Corresponding Author: Julraht Konsil, Department of Clinical Pharmacy, Faculty of Pharmaceutical Sciences, KhonKaen University, Thailand. julkon@kku.ac.th
JPPS Contents
Published by the Canadian Society for Pharmaceutical Sciences.
Copyright © 1998 by the Canadian Society for Pharmaceutical Sciences.
http://www.ualberta.ca/~csps